Increased employment
Published:
Between the first quarter of 2018 and the first quarter of 2019, there has been an increase in the number of employed persons by 32 000. The levels fluctuate somewhat over the year, but there is a clear upwards trend.
- Full set of figures
- Labour force survey
- Series archive
- Labour force survey (archive)
We are still not back at the employment levels we had ten years ago. Nevertheless, we see in Figure 1 that there are improvements over the last couple of years, as 2019 is the best result for the first quarter of the year since 2016.
Figure 1. Employment rate, persons aged 15-74 years, first quarter
| Employment rate (per cent) | |
| 2006 | 68.2 |
| 2007 | 69.9 |
| 2008 | 71.3 |
| 2009 | 70.5 |
| 2010 | 68.7 |
| 2011 | 68.6 |
| 2012 | 68.8 |
| 2013 | 68.1 |
| 2014 | 67.7 |
| 2015 | 67.6 |
| 2016 | 67.0 |
| 2017 | 66.3 |
| 2018 | 66.8 |
| 2019 | 67.2 |
Steady growth in education levels
Despite notable changes in employment and unemployment over the last ten years, we see that the education level is rising, both among the employed and among the unemployed. Persons with only lower secondary education made up 20 per cent of the employed and 50 of the unemployed in 2010. In 2019 the corresponding numbers are 15 and 38 per cent.
Figure 2. Persons with only lower secondary education, as a proportion of employed and unemployed
| As a proportion of employed | As a proportion of unemployed | |
| Q1-2010 | 20.0 | 50.0 |
| Q2-2010 | 19.4 | 48.1 |
| Q3-2010 | 19.5 | 38.3 |
| Q4-2010 | 18.8 | 40.9 |
| Q1-2011 | 19.1 | 47.1 |
| Q2-2011 | 19.6 | 47.9 |
| Q3-2011 | 19.5 | 42.0 |
| Q4-2011 | 19.2 | 39.3 |
| Q1-2012 | 18.9 | 42.0 |
| Q2-2012 | 19.7 | 39.6 |
| Q3-2012 | 19.3 | 40.5 |
| Q4-2012 | 17.2 | 41.6 |
| Q1-2013 | 17.2 | 47.1 |
| Q2-2013 | 17.4 | 42.3 |
| Q3-2013 | 17.5 | 36.9 |
| Q4-2013 | 17.3 | 41.2 |
| Q1-2014 | 17.5 | 38.0 |
| Q2-2014 | 17.5 | 42.4 |
| Q3-2014 | 17.4 | 38.5 |
| Q4-2014 | 17.6 | 37.8 |
| Q1-2015 | 18.2 | 39.3 |
| Q2-2015 | 18.7 | 44.4 |
| Q3-2015 | 17.8 | 36.7 |
| Q4-2015 | 15.6 | 37.3 |
| Q1-2016 | 16.3 | 39.7 |
| Q2-2016 | 16.7 | 36.6 |
| Q3-2016 | 17.0 | 33.6 |
| Q4-2016 | 16.4 | 35.3 |
| Q1-2017 | 16.6 | 40.2 |
| Q2-2017 | 16.9 | 42.9 |
| Q3-2017 | 17.0 | 38.6 |
| Q4-2017 | 16.0 | 39.0 |
| Q1-2018 | 15.9 | 37.3 |
| Q2-2018 | 16.2 | 39.4 |
| Q3-2018 | 16.1 | 34.2 |
| Q4-2018 | 16.4 | 39.8 |
| Q1-2019 | 15.6 | 38.0 |
Movements in the labour market between the last two quarters
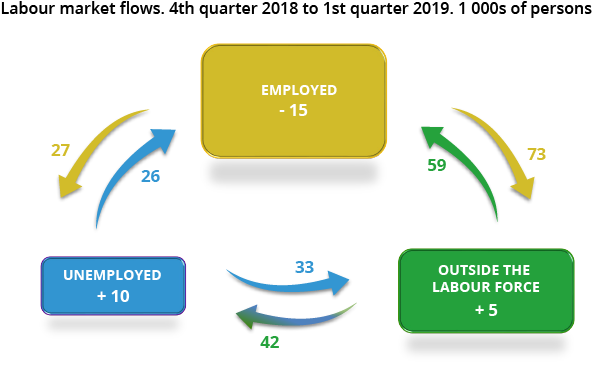
In addition to presenting levels, the Labour Force Survey also shows quarterly flows between the three labour market statuses (employed, unemployed, outside the labour force). Figure 3 shows these movements between quarter four of 2018 and the first quarter of 2019. Overall, there was an increase of 5000 persons outside the labour force. By only looking at the total this looks like a moderate change. However, by taking the full flows into account, we see that this total consists of
- 42 000 persons changing from outside the labour force to unemployed
- 59 000 from outside the labour force to employed
- 73 000 from employed to outside the labour force
- 33 000 from unemployed to outside the labour force
Contact
-
Håvard Hungnes Lien
-
Tor Petter Bø
-
Ole Sandvik
-
Camilla Sundt
-
Statistics Norway's Information Centre

