Content
Published:
This is an archived release.
Slight decrease in unemployment
Registered unemployment among first generation immigrants decreased from 8.1 to 7.9 per cent from August 2000 to August 2001. For the entire population the unemployment rate was stable at 2.9 per cent - all figures calculated as a fraction of the labour force.
Unemployment among immigrants from Eastern Europe decreased the most, 0.8 percentage points.
The unemployment rate among Africans is still the highest. At the end of August 2001 their rate was 14.7 per cent. Immigrants from South and Central America had the lowest unemployment rate among the non-westerners, 8.9 per cent. The rates for immigrants from the western regions were as usual only a few decimals higher than for the entire population. These trends are in fact very stable in the Norwegian labour market.
Largest decrease among African women
Among males, immigrants from Eastern Europe had the highest decrease, 1.1 percentage points from August 2000 to August 2001, while female immigrants from Africa had the highest decrease, 1.4 percentage points. In the entire population men had an unemployment rate of 2.8 per cent while the women's rate was 2.9 per cent. Among immigrants these numbers were 8.2 and 7.5 per cent.
Labour market schemes
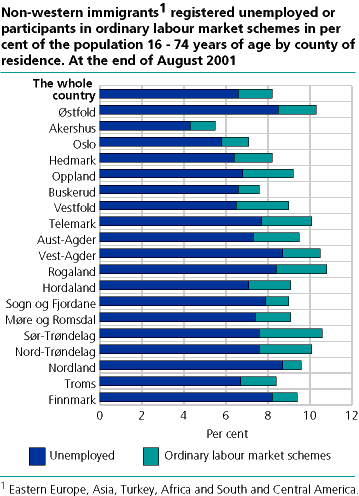
At the national level there has been a decrease in the number of persons covered by ordinary labour market schemes (job programmes) at about 35 per cent from August 2000 to August 2001 (9 711 to 6 330 participants). Among immigrants this decrease was 22 per cent (3 165 to 2 467 participants). These 2 467 immigrants accounted forabout 40 per cent of all persons covered by such schemes and included mostly non-westerners immigrants. In relation to the whole immigrant population 16-74 years, immigrants had a percentage of participants of 1.1 while the percentage for the whole population was 0.2.
Tables:
- Table 1 Registered unemployed aged 16-74 years by region of birth and sex . In absolute numbers and per cent of the labour force. By the end of May 2000, August 2000, May 2001 and August 2001
- Table 2 Participants in ordinary labour market schemes (job programmes) by region of birth and sex . In absolute numbers and per cent of persons aged 16-74 years. By the end of May 2000, August 2000, May 2001 and August 2001
- Table 3 Registered unemployed and participants in ordinary labour market schemes (job programmes) by region of birth and time of residence in Norway. In per cent of persons in total aged 16-74 years. By the end of August 2000 and 2001
- Table 4 Registered unemployed by region of birth and county of residence. Absolute numbers and in per cent of persons in total 16-74 years. By the end of August 2000
- Table 5 Registered unemployed by region of birth and county of residence. Absolute numbers and in per cent of persons in total 16-74 years. By the end of August 2001
- Table 6 Registered participants in ordinary labour market schemes, by region of birth and county of residence. Absolute numbers and in per cent of persons in total 16-74 years. By the end of August 2001
Additional information
The unemployment figures are based on the Norwegian Labour and Welfare Organisation’s register of jobseekers and are calculated as a share of the labour force, which is the sum of employed persons and registered unemployed persons, i.e. people offering their labour on the labour market.
Contact
-
Statistics Norway's Information Centre
E-mail: informasjon@ssb.no
tel.: (+47) 21 09 46 42

