Content
Published:
This is an archived release.
Lowest immigrant unemployment in 18 years
Registered unemployment among immigrants fell from 6.0 per cent to 4.4 per cent from November 2006 to November 2007. In the rest of the population, the registered unemployment fell from 1.8 to 1.3 per cent.
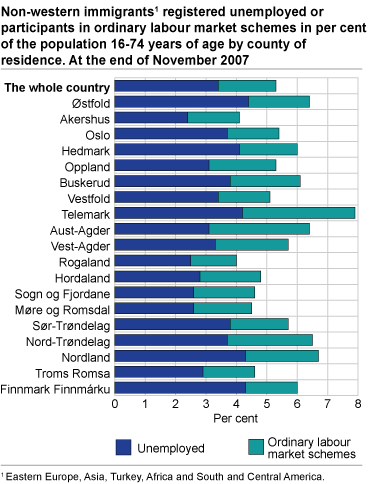
9 193 immigrants were registered unemployed in the fourth quarter of 2007, a decline of 2 000 from the corresponding period last year. The unemployment rate for this group was at the lowest level ever recorded since the statistics were established in 1989.
|
Immigrants are defined as first-generation immigrants, i.e. born abroad by foreign-born parents. They must be registered as settled in Norway for at least six months. The figures are based on the Directorate of Labour's register of job seekers and are calculated as a fraction of the labour force. |
Stable differences
In relative terms, the decrease in unemployment was similar in all groups. Thus there is no levelling out between immigrants and the majority population. Registered unemployment among immigrants is still three times higher than in the majority population. This difference has been stable for a long time and is to some extent due to the relatively large number of immigrants who are newcomers on the labour market. Thus the proportion of employed in the labour force is somewhat lower in this group compared to the majority population. As long as there is immigration at a certain level this also applies in periods of low unemployment.
Differences among immigrant groups unchanged
Within the four non-western groups the decline in the unemployment rate varied between 2 and 3 percentage points. Immigrants from Africa had the highest unemployment rate at 10.1 per cent. Immigrants from Asia had the second highest rate at 5.9 per cent, while the unemployment rate for immigrants from Eastern Europe (except EU countries) and South and Central America was 5.3 per cent and 4.7 per cent respectively. As in previous quarters, immigrants from western regions and the EU countries in Eastern Europe had an unemployment rate slightly below 2 per cent.
Slightly higher unemployment among women
The unemployment rate for male and female immigrants was 4.2 per cent and 4.4 per cent respectively. In the rest of the population, the unemployment rate was 1.3 per cent for both men and women. This is contrary to traditional gender differences in registered unemployment, where immigrant men usually have a higher unemployment rate than immigrant women. This new pattern is probably due to an increase in female job seekers due to the favourable labour market conditions.
Few descendants registered unemployed
Only 290 descendants, defined as people born in Norway by foreign-born parents, were registered unemployed in November 2007. The majority were aged 16-29 years, and in this group the unemployment rate was 2.6 per cent. In the rest of the population, the unemployment rate for this age group 2.0 per cent.
Participants on labour market schemes slightly increased
Despite the falling unemployment rate, there was a slight increase in the number of immigrants on ordinary labour market schemes (job programmes) from 4 454 in November 2006 to 4 798 in November 2007, i.e. a growth at 244 participants. In total, 11 763 people participated in such labour market schemes. In the majority population, there was a decline of 1 200 participants. The immigrant participants had mainly non-western background.
As a percentage of the immigrant population, the participation rate was 1.4 per cent in November 2007 compared with 1.5 per cent in the previous year. Hence, the slight increase in the number of immigrant participants has not resulted in an increase in the participant rate. In the rest of the population, the participant rate was only 0.2 per cent. Immigrants from Africa had the highest participant rate at 3.4 per cent.
Tables:
- Table 1 Registered unemployed by immigrant background, region of birth and sex. In absolute numbers and in per cent of the labour force. By the end of November 2006 and 2007
- Table 2 Participants on ordinary labour market schemes (job programmes) by immigrant background, region of birth and sex. Absolute numbers and in per cent of persons aged 16 to 74 years. By the end of November 2006 and 2007
- Table 3 Registered unemployed, by region of birth and time of residence in Norway. By the end of November 2006 and 2007. Absolute figures and in per cent of persons in total aged 16-74 years
- Table 4 Registered unemployed by immigrant background, region of birth and county of residence. Absolute numbers and in per cent of persons aged 16 to 74 years in each group. By the end of November 2006 and 2007
- Table 5 Participants on ordinary labour market schemes (job-programmes) by immigrant background, region of birth and county of residence. Absolute numbers and in per cent of persons aged 16 to 74 years in each group. By the end of November 2006 and 2007
- Table 6 Registered unemployed by sex, immigrant background, region of birth and age. Absolute numbers and in per cent of the labour force. By the end of November 2006 and 2007
Additional information
The unemployment figures are based on the Norwegian Labour and Welfare Organisation’s register of jobseekers and are calculated as a share of the labour force, which is the sum of employed persons and registered unemployed persons, i.e. people offering their labour on the labour market.
Contact
-
Statistics Norway's Information Centre
E-mail: informasjon@ssb.no
tel.: (+47) 21 09 46 42

