Content
Published:
This is an archived release.
490 000 employed in municipal activities
Almost 490 000 persons were employed in municipal activities in 2009. This is an increase of 2 per cent compared to 2008.
| Total, municipalities and counties | 2005 | 2006 | 2007 | 2008 | 2009 |
Change
2008-2009 |
Percentage change
2008-2009 |
||||||||||||||||||||||||||||||||||||||||||||||||||||||||||||||||||||||||
|---|---|---|---|---|---|---|---|---|---|---|---|---|---|---|---|---|---|---|---|---|---|---|---|---|---|---|---|---|---|---|---|---|---|---|---|---|---|---|---|---|---|---|---|---|---|---|---|---|---|---|---|---|---|---|---|---|---|---|---|---|---|---|---|---|---|---|---|---|---|---|---|---|---|---|---|---|---|---|---|
| Employed | 450 564 | 456 312 | 472 461 | 479 300 | 488 684 | 9 384 | 2,0 | ||||||||||||||||||||||||||||||||||||||||||||||||||||||||||||||||||||||||
| Contracted man-years | 340 846 | 350 886 | 364 066 | 373 745 | 380 902 | 7 157 | 1.9 | ||||||||||||||||||||||||||||||||||||||||||||||||||||||||||||||||||||||||
| Contracted man-years adjusted for sick-leave and maternity leave | 308 599 | 317 620 | 329 579 | 338 646 | 342 988 | 4 343 | 1.3 | ||||||||||||||||||||||||||||||||||||||||||||||||||||||||||||||||||||||||
| of which | |||||||||||||||||||||||||||||||||||||||||||||||||||||||||||||||||||||||||||||||
| Municipality, total | |||||||||||||||||||||||||||||||||||||||||||||||||||||||||||||||||||||||||||||||
| Employed | 406 789 | 411 396 | 426 152 | 433 600 | 441 899 | 8 299 | 1.9 | ||||||||||||||||||||||||||||||||||||||||||||||||||||||||||||||||||||||||
| Contracted man-years | 303 371 | 312 249 | 324 611 | 334 178 | 340 287 | 6 109 | 1.8 | ||||||||||||||||||||||||||||||||||||||||||||||||||||||||||||||||||||||||
| Contracted man-years adjusted for sick-leave and maternity leave | 273 616 | 281 527 | 292 706 | 301 735 | 305 348 | 3 613 | 1.2 | ||||||||||||||||||||||||||||||||||||||||||||||||||||||||||||||||||||||||
| County, total | |||||||||||||||||||||||||||||||||||||||||||||||||||||||||||||||||||||||||||||||
| Employed | 43 775 | 44 916 | 46 309 | 45 700 | 46 785 | 1 085 | 2.4 | ||||||||||||||||||||||||||||||||||||||||||||||||||||||||||||||||||||||||
| Contracted man-years | 37 475 | 38 637 | 39 456 | 39 567 | 40 615 | 1 048 | 2.6 | ||||||||||||||||||||||||||||||||||||||||||||||||||||||||||||||||||||||||
| Contracted man-years adjusted for sick-leave and maternity leave | 34 983 | 36 093 | 36 873 | 36 910 | 37 640 | 730 | 2.0 | ||||||||||||||||||||||||||||||||||||||||||||||||||||||||||||||||||||||||
| 1 | The figures for Oslo municipality are included in the county-figures for upper secondary school only. |
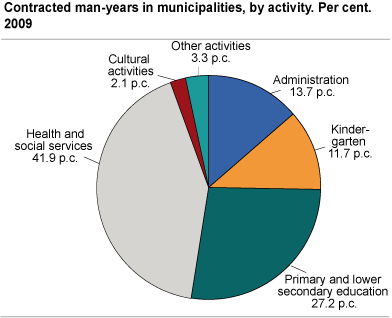
More than 90 per cent of employees were employed by the municipalities. Due to a high degree of part-time working, this amounts to 340 000 contracted man-years. The total growth in contracted man-years was 1.8 per cent from 2008 to 2009.
Increase in staff in kindergartens
Contracted man-years in kindergartens increased by 4.2 per cent compared to 2008, but health and social services still have 42 per cent of the total man-years in the municipalities. The man-years in health and social services increased by 1.6 per cent in the same period.
Increased number of employees in upper secondary education
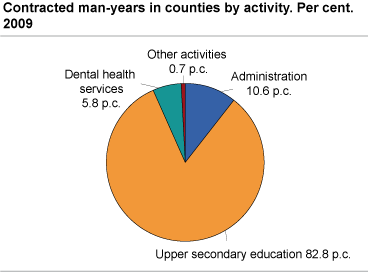
Upper secondary education amounts to a total of 83 per cent of the contracted man-years in the counties. Compared to 2008, upper secondary education has had an increase of 600 man-years. The increase is due to an improvement in the registration in one county. The man-years in the county dental health services amount to 6 per cent. The distribution among the areas of responsibility for the counties has been largely unchanged over the last 5 years.
Tables:
The statistics is now published as KOSTRA.
Contact
-
Statistics Norway's Information Centre
E-mail: informasjon@ssb.no
tel.: (+47) 21 09 46 42


