Content
Published:
This is an archived release.
Less differences in household sizes
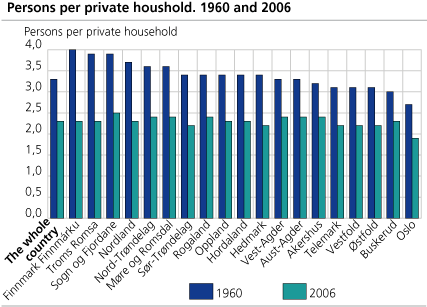
Even though relatively large variations in household size still exist, the difference between counties has decreased over time. Oslo is still, as it was in 1960, the county with the smallest households.
On 1 January 2006, the number of persons per household was on average 2.3 against 3.3 in The Population and Housing Census in 1960. Today the average size of households is clearly smallest in Oslo with 1.9 persons per household, while Sogn og Fjordane is the county with the largest households with 2.5 persons per household. These are some of the results from the register-based statistics on families and households.
In 1960, Oslo was also the county with the smallest households with an average of 2.7 persons per household. At the same time Finnmark county had the largest households with an average of 4.0 persons per household, closely followed by Sogn og Fjordane and Troms with an average of 3.9. Since the counties with the largest households in 1960 haveexperienced the largest decrease in the size of the households, the regional differences are smaller today than they were 46 years ago.
One in two households consists of one person only
Oslo is the county with most one-person households. More than one fourth of the population lived alone, and more than half of all the households in Oslo consisted of one person only. In the whole country, approximately 784 000 persons were living alone by 1 January 2006, i.e. almost one in five persons. At country level 39 per cent of the households consist of one person only. This is an increase from 14 per cent in 1960 and 28 per cent in 1980.
Also by looking at the portion of the population living alone, the difference between counties has decreased. In 1960, the portion of the population living alone in Oslo was more than 3 times larger than the corresponding portion in Sogn og Fjordane, 8.1 and 2.4 percent respectively. In 2006 Akershus is the county with the lowest portion of one-person households with 13 percent, while the portion in Oslo is approximately twice as big with 28 per cent.
Small households in cities and fringe municipalities
In addition to the differences between counties we find large variations within the counties. The number of small households is highest in central urban municipalities and in fringe areas. Many municipalities in Northern Norway and large areas in the county Hedmark have small households. The largest households are mainly found in Southern and Western Norway, and also in municipalities in the commuting areas around the larger cities.
|
The statistics is based on legal residence address on 1 January 2006. This means that unmarried students registered at their parents' address, are regarded as members of the household of their parents. Empiricism show that statistics based on registers and legal residence address at the average will give larger household sizes than statistics from surveys based on interviews and place of usual residence. |
Tables:
- Table 1 Population by, sex, age and type of household. 1 January 2006 (Corrected 14 May 2007)
- Table 2 Private households and persons per private household, by county. 1960, 1970, 1980, 1990, 2001, 2005 and 2006 (Corrected 14 May 2007)
- Table 3 Private households, by type of household. 1980, 1990, 2001, 2005 and 2006. Number and per cent (Corrected 14 May 2007)
- Table 4 Private households and persons in private households, by size of household, county, municipality and urban district. 1. januar 2006. Per cent (Corrected 14 May 2007)
- Table 5 Private households, by type of household, county, municipality and urban district. 1 January 2006 (Corrected 14 May 2007)
- Table 6 Private households, by type of household, county, municipality and urban district. 1 January 2006. Per cent (Corrected 14 May 2007)
- Table 7 Private households and persons in private households, by type of household. 1 January 2006. Numbers and per cent (Corrected 14 May 2007)
- Table 8 Persons in private households, by type of household, county, municipality and urban district. 1 January 2006. Per cent (Corrected 14 May 2007)
- Table 9 Families, by type of family, county, municipality and urban district. 1 January 2006 (Corrected 14 May 2007)
- Table 10 Families with children 0-17 years by, county, type of family and number of children. 1 January 2006 (Corrected 14 May 2007)
- Table 11 Persons in private households, by sex, cohabitation arrangements and age. 1 January 2006 (Corrected 14 May 2007)
- Table 12 Couples and persons in couples with and without children in private households, by cohabitation arrangements, number of children in the family and age. 1 January 2006 (Corrected 14 May 2007)
- Table 13 Couples with and without children in private households, by cohabitation arrangements, county, municipality and urban district. 1 January 2006. Per cent (Corrected 14 May 2007)
- Table 14 Persons 18 years and over in private households. Percentage living/not living as couples, by age, county, municipality and urban district.l. 1 January 2006. Per cent (Corrected 14 May 2007)
Contact
-
Statistics Norway's Information Centre
E-mail: informasjon@ssb.no
tel.: (+47) 21 09 46 42
-
Espen Andersen
E-mail: espen.andersen@ssb.no
tel.: (+47) 92 61 00 46
-
Ane Margrete Tømmerås
E-mail: ane.tommeras@ssb.no
tel.: (+47) 91 99 29 62
-
Oppdrag befolkningsstatistikk
E-mail: befolkning@ssb.no


