Content
Published:
This is an archived release.
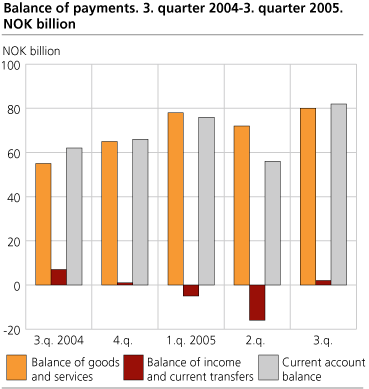
NOK 82 billion current account surplus
According to preliminary figures Norway's current account surplus amounted to NOK 82 billion in the third quarter 2005. Compared with the second quarter of 2004, the surplus rose by NOK 21 billion.
Record high surplus
According to preliminary figures, the balance of goods and services was NOK 80.3 billion in the third quarter of 2005. The balance of goods and the balance of services ended at NOK 79.0 billion and NOK 0.3 billion respectively. Compared with the third quarter last year the goods and services balance rose by NOK 25.1 billion, the most important single factor being the rise in oil prices.
The balance of trade in services was reduced in the third quarter of 2005 compared with the previous quarter and the third quarter of 2004 caused by the total value of imports of services, which increased more than the exports. Imports of travel abroad and business services increased the most from the corresponding quarter last year.
Compared with the second quarter this year the reduced surplus on the services balance is mainly due to growth in travel imports.
Surplus in the account of income and current transfers
The balance of net income and transfers is estimated at a surplus of NOK 2.1 billion for the third quarter of 2005, a decrease of NOK 4.5 billion compared to third quarter last year.
Increase in net external assets
On the financial account the Norwegian investments abroad exceeded NOK 198 billion, and were substantially higher than non-resident investments in Norway. Both outward and inward direct investments had negative figures NOK -11 billion and NOK -25 billion respectively, according to the preliminary figures for the third quarter of 2005.
Preliminary estimates show that Norway's net external assets increased by NOK 83 billion in the third quarter of 2005 and were estimated at NOK 1 070 billion at the end of the quarter.
Revised figures for first and second quarter
In the first quarter figures interest and dividends paid to abroad have been revised NOK 3.4 billion and NOK -2.3 billion respectively due to updated information. The revisions, however, do not affect the current account balance because of other small revisions in the balance of goods and services. For the second quarter the current account balance has been revised down by NOK 7.5 billion due to upwards revisions of interests and dividends paid to abroad.
On the financial account, especially the first quarter figures have been revised due to updated information and improved estimation procedures on market values of shares and securities.
Revised figures for 2003 and 2004
Final figures for 2003 show that the current account balance has been revised upwards NOK 4 billion compared to preliminary figures. It is mainly shipping services and reinvested earnings that have had the largest revisions. Revised figures for reinvested earnings also effect direct investments to and from abroad in the financial account.
Revised figures for 2004 show an upward revision in the current account balance of NOK 3.6 billion due to decreased import of services. The financial account figures for Norwegian investments abroad and foreign investment in Norway had both an upward revisions at NOK 4.5 billion and NOK 7.7 billion respectively. Norway’s net external assets have been revised downwards with NOK 221 billion, and were estimated at NOK 839 billion at the end of the year. All revisions are due to updated information.
As of the first quarter of 2005, the Norwegian Balance of Payments statistics are released on a quarterly basis due to a fundamental change in the data collection system. Previously, monthly data on bank payments between residents and non-residents were used. Now data are collected directly from the various residents engaged in economic transactions with non-residents. This change means that users should be more careful in comparing the data for 2005 with data from previous periods. The figures for merchandise trade are not affected by the change.
| Balance of payments. 3. quarter 2004 to 3. quarter 2005. NOK billion |
| 2004 | 3. quarter 2004 | 4. quarter 2004 | 1. quarter 2005 | 2. quarter 2005 | 3. quarter 2005 | ||||||||||||||||||||||||||||||||||
|---|---|---|---|---|---|---|---|---|---|---|---|---|---|---|---|---|---|---|---|---|---|---|---|---|---|---|---|---|---|---|---|---|---|---|---|---|---|---|---|
| Balance of goods and services | 241 | 55 | 65 | 78 | 72 | 80 | |||||||||||||||||||||||||||||||||
| Balance of income and current transfers | -10 | 7 | 1 | -5 | -16 | 2 | |||||||||||||||||||||||||||||||||
| Current account balance | 231 | 62 | 66 | 73 | 56 | 82 | |||||||||||||||||||||||||||||||||
| Capital transfers etc. to abroad, net | 1 | - | - | -3 | 1 | 1 | |||||||||||||||||||||||||||||||||
| Net lending | 230 | 62 | 66 | 76 | 56 | 82 | |||||||||||||||||||||||||||||||||
| Direct investment, net | 8 | 28 | -3 | 3 | 18 | 15 | |||||||||||||||||||||||||||||||||
| Portifolio investment, net | 192 | 98 | 55 | 5 | 193 | -85 | |||||||||||||||||||||||||||||||||
| Other investment, net | 31 | -64 | 14 | 38 | -190 | 161 | |||||||||||||||||||||||||||||||||
| Revaluations, net | 27 | 2 | 8 | 3 | 16 | 2 | |||||||||||||||||||||||||||||||||
| Increase in Norway`s net assets | 257 | 64 | 74 | 79 | 72 | 83 | |||||||||||||||||||||||||||||||||
| International investment position, net | 839 | 765 | 839 | 917 | 987 | 1 070 | |||||||||||||||||||||||||||||||||
Additional information
For more information about price and volume growth of exports and imports, see the quarterly national accounts.
More details about exports and imports of goods and services are available in the statistics on external trade in goods and services.
Contact
-
Håvard Sjølie
E-mail: havard.sjolie@ssb.no
tel.: (+47) 40 90 26 05
-
Linda Wietfeldt
E-mail: linda.wietfeldt@ssb.no
tel.: (+47) 40 90 25 48

