Content
Published:
This is an archived release.
Surplus in the balance of income and transfers
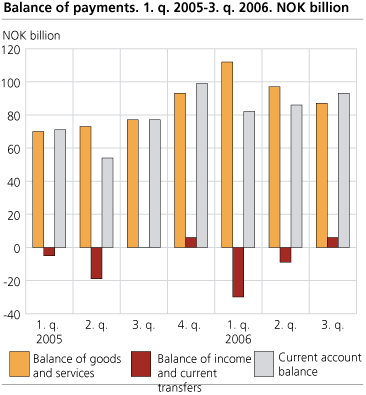
There was a NOK 6 billion increase in the balance of income and current transfers in the third quarter, following a deficit in the last two quarters. Norway’s current account surplus was NOK 93 billion.
Compared with the second quarter last year and the same quarter this year, the account surplus is NOK 4 billion and NOK 16 billion higher respectively.
The balance of net income and transfers has increased NOK 14.8 billion from the second to the third quarter this year. The main reason is a reduction of dividends to abroad.
Drop in balance of goods and services from last quarter
According to preliminary figures, the balance of goods and services was reduced NOK 10.8 billion compared to the second quarter of 2006. The balance of goods and services was NOK 86.5 billion in the third quarter.
Norway exported goods at the amount of NOK 188.8 billion in the third quarter this year. A reduction in the quantity of exports of crude oil and natural gas explains most of the reduction in total exports of goods. Imports of goods were NOK 101.5 billion, or 11 percent higher than corresponding period last year. There was a surplus in the balance of trade in goods of NOK 87.2 billion in the third quarter this year, 2 percent lower than in the third quarter of 2005.
The balance of trade in services was almost in balance. The exports of services were NOK 54.3 billion, slightly lower than imports of services. There was an increase in exports of gross shipping receipts and travel, while exports of oil drilling services and business services were reduced compared to the second quarter. The growth in total imports of services can mainly be explained by travel.
Financial account transactions
On the financial account, the Norwegian investments abroad reached NOK 297 billion, while non-residents investments in Norway are estimated at 220 billion in the third quarter of 2006. Outward and inward direct investments transactions ended at NOK 52 billion and NOK 14.8 billion respectively.
Preliminary estimates show that Norway's net external assets increased by NOK 240 billion in the second quarter of 2006, and were estimated at NOK 1 679 billion at the end of the quarter.
Final figures 2004
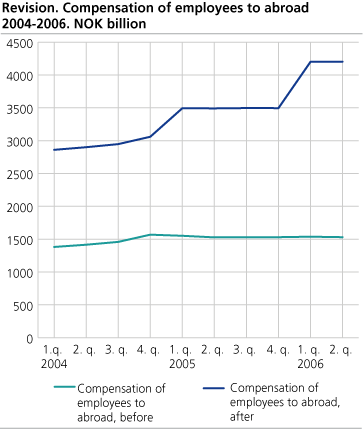
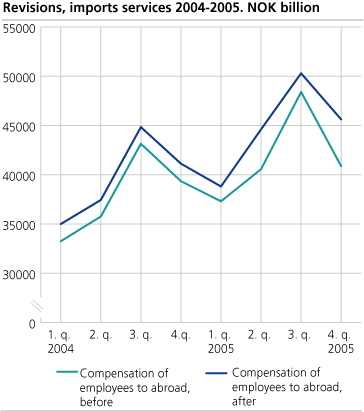
Compared to preliminary figures, the final figures for 2004 show that the current account balance has been revised downwards NOK 11 billion. Among exports and imports, there are mainly shipping and financial services that have had the largest revisions. Upwards revision of the figure for compensation of employees to abroad resulted in a net downward revision of the balance of income and current transfers.
Norwegian investments abroad in the financial account has been revised upwards NOK 13 billion in total, and foreign investment in Norway has been revised upwards NOK 0.5 billion. Norway's net external assets where estimated at NOK 954 billion at the end of the year.
Revision of 2005 figures
The current account balance has been revised down NOK 15.7 billion in 2005. The balance of goods and service and the balance of income and transfer have both been revised down by respectively NOK 9.1 billion and NOK 6.7 billion. New and revised survey data is the reason for the revisions.
Norwegian investments abroad in the financial account has been revised upwards NOK 16.4 billion in total, and foreign investment in Norway has been revised upwards NOK 75.3 billion. The change in Norway’s net assets has been revised upwards NOK 54.2 billion. Norway's net external assets where estimated at NOK 1 379 billion at the end of the year.
Revised figures 1994-2005
Please take notice of revised figures back to 1994 in this publication. For more information use the following link: http://www.ssb.no/nr/
| Balance of payments. 3. quarter 2005 to 3. quarter 2006. Billion kroner |
| 2005 | 3. quarter 2005 | 4. quarter 2005 | 1. quarter 2006 | 2. quarter 2006 | 3. quarter 2006 | ||||||||||||||||||||||||||||||||||
|---|---|---|---|---|---|---|---|---|---|---|---|---|---|---|---|---|---|---|---|---|---|---|---|---|---|---|---|---|---|---|---|---|---|---|---|---|---|---|---|
| Balance of goods and services | 319 | 77 | 93 | 112 | 97 | 87 | |||||||||||||||||||||||||||||||||
| Balance of income and current transfers | -18 | 0 | 6 | -30 | -9 | 6 | |||||||||||||||||||||||||||||||||
| Current account balance | 301 | 77 | 99 | 88 | 89 | 92 | |||||||||||||||||||||||||||||||||
| Capital transfers etc. to abroad, net | 4 | 1 | 3 | - | - | - | |||||||||||||||||||||||||||||||||
| Net lending | 297 | 76 | 96 | 82 | 88 | 92 | |||||||||||||||||||||||||||||||||
| Direct investment, net | 69 | -2 | 58 | 7 | 2 | 37 | |||||||||||||||||||||||||||||||||
| Portifolio investment, net | 40 | -65 | -90 | 156 | -22 | 189 | |||||||||||||||||||||||||||||||||
| Other investment, net | 107 | 163 | 105 | -96 | 48 | -158 | |||||||||||||||||||||||||||||||||
| Revaluations, net | 127 | -16 | 90 | -61 | -50 | 148 | |||||||||||||||||||||||||||||||||
| Increase in Norway`s net assets | 424 | 60 | 187 | 21 | 39 | 240 | |||||||||||||||||||||||||||||||||
| International investment position, net | 1 379 | 1 192 | 1 379 | 1 400 | 1 439 | 1 679 | |||||||||||||||||||||||||||||||||
Additional information
For more information about price and volume growth of exports and imports, see the quarterly national accounts.
More details about exports and imports of goods and services are available in the statistics on external trade in goods and services.
Contact
-
Håvard Sjølie
E-mail: havard.sjolie@ssb.no
tel.: (+47) 40 90 26 05
-
Linda Wietfeldt
E-mail: linda.wietfeldt@ssb.no
tel.: (+47) 40 90 25 48


