Content
Published:
This is an archived release.
Higher income from abroad
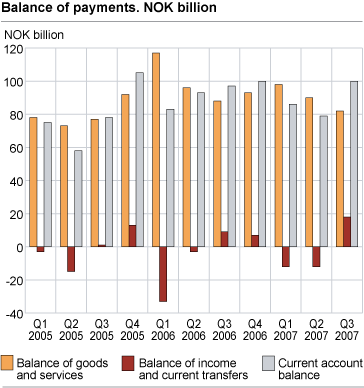
The surplus in the balance of income and transfers was NOK 17.8 billion in the third quarter of 2007. This is more than a doubling from the corresponding period last year. The increase was mainly due to increased income from abroad, and had a positive effect on the current account surplus.
The surplus in the balance of income and transfers was NOK 9.1 billion higher in the third quarter of 2007 than in the corresponding period last year. In the same period, total income from abroad increased by 23 per cent, while total expenditure rose by a modest 6.5 per cent. This had a positive effect on the current account, which came to NOK 100 billion.
The balance of income and transfers shows the same trend in the first three quarters of 2007 as in the two previous years; a deficit in the first and second quarter followed by a surplus in the third quarter.
Reduced surplus in the trade balance
The trade balance in goods and services ended at NOK 82.2 billion, NOK 6.1 billion less than in the third quarter of 2006.
The value of total exports of goods was NOK 193.5 billion in the third quarter of 2007, NOK 5.2 billion above the same quarter last year. Norway’s import of goods came to NOK 113.6 billion, an increase of 13 per cent from the corresponding period in 2006.
Trade in services generated a surplus of NOK 2.4 billion in the second quarter of 2007. Exports of services came to NOK 61.1 billion, while imports came to NOK 58.7 billion.
Increased investments abroad
Norway’s total investments abroad were NOK 242.6 billion in the third quarter, while non-residents' investments in Norway are estimated at NOK 190.5 billion. Net outward direct investment transactions were NOK 16.9 billion, while net inward direct investment transactions were fell by NOK 22.7 billion.
Preliminary estimates show that Norway's net external assets increased by NOK 26 billion in the third quarter.
| 2005 | 2006 | 1. quarter 2006 | 2. quarter 2006 | 3. quarter 2006 | 4. quarter 2006 | 1. quarter 2007 | 2. quarter 2007 | 3. quarter 2007 | |||||||||||||||||||||||||||||||
|---|---|---|---|---|---|---|---|---|---|---|---|---|---|---|---|---|---|---|---|---|---|---|---|---|---|---|---|---|---|---|---|---|---|---|---|---|---|---|---|
| Balance of goods and services | 321 | 393 | 116 | 96 | 88 | 93 | 98 | 90 | 82 | ||||||||||||||||||||||||||||||
| Balance of income and current transfers | -4 | -20 | -34 | -3 | 9 | 7 | -12 | -12 | 18 | ||||||||||||||||||||||||||||||
| Current account balance | 317 | 373 | 83 | 93 | 97 | 100 | 86 | 79 | 100 | ||||||||||||||||||||||||||||||
| Capital transfers etc. to abroad, net | 2 | 1 | 0 | 1 | 0 | 0 | 0 | 1 | 0 | ||||||||||||||||||||||||||||||
| Net lending | 315 | 373 | 83 | 93 | 97 | 100 | 86 | 78 | 100 | ||||||||||||||||||||||||||||||
| Direct investment, net | 108 | 88 | 47 | 19 | 43 | -21 | 57 | 4 | 40 | ||||||||||||||||||||||||||||||
| Portifolio investment, net | 32 | 482 | 161 | -18 | 178 | 161 | -5 | -48 | 175 | ||||||||||||||||||||||||||||||
| Other investment, net | 106 | -310 | -99 | 44 | -161 | -95 | 20 | 92 | -167 | ||||||||||||||||||||||||||||||
| Revaluations, net | 73 | -67 | -64 | -74 | 156 | -85 | -48 | -58 | -74 | ||||||||||||||||||||||||||||||
| Increase in Norway`s net assets | 388 | 306 | 19 | 19 | 253 | 15 | 38 | 20 | 26 | ||||||||||||||||||||||||||||||
Quarterly balance of payments data for the period 1981-2007 are available in StatBank Norway.
Additional information
For more information about price and volume growth of exports and imports, see the quarterly national accounts.
More details about exports and imports of goods and services are available in the statistics on external trade in goods and services.
Contact
-
Håvard Sjølie
E-mail: havard.sjolie@ssb.no
tel.: (+47) 40 90 26 05
-
Linda Wietfeldt
E-mail: linda.wietfeldt@ssb.no
tel.: (+47) 40 90 25 48

