Content
Published:
This is an archived release.
High oil prices gave a large surplus
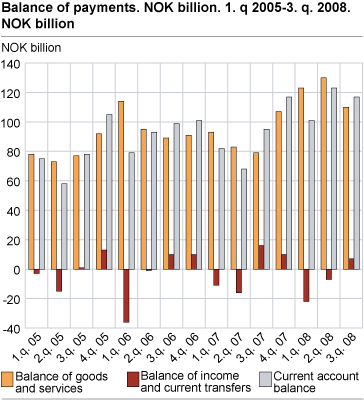
According to preliminary figures the current account surplus was NOK 117 billion in the third quarter of 2008, which was 23 per cent higher than the surplus in the third quarter of 2007. The improvement was mainly due to the effect of high prices on exports of oil and natural gas.
The surplus of 43 per cent or NOK 32 billion in the balance of trade in goods explained the growth in the current account surplus. The main reason was an increase in the value of oil and gas exports of 30 per cent, caused by a 40 per cent price increase, while the volume was reduced by 7 per cent.
For more information about changes in prices and volume, see quarterly national accounts .
Trade in services generated a surplus of NOK 4 billion in the third quarter of 2008. Exports of services amounted to NOK 68 billion, an increase of 9 per cent from the third quarter of 2007. Imports of services ended at NOK 64 billion. The balance of goods and services fell 21 per cent from the third quarter last year.
Net income account surplus
There was a positive net balance of income and current transfers of NOK 7 billion in the third quarter of 2008, which is a reduction of 57 per cent compared to the third quarter last year.
Financial account transactions
According to the financial account, Norwegian investments abroad amounted to NOK 236 billion, while non-residents' investments in Norway amounted to NOK 122 billion. Net outward direct investment transactions came to NOK 48 billion, while net inward direct investment transactions were minus NOK 22 billion. The net assets increased by NOK 191 billion due to net lending of NOK 116 billion and by net revaluations of NOK 75 billion.
| 2006 | 2007 | 3. quarter 2006 | 4. quarter 2006 | 1. quarter 2007 | 2. quarter 2007 | 3. quarter 2007 | 4. quarter 2007 | 1. quarter 2008 | 2. quarter 2008 | 3. quarter 2008 | |||||||||||||||||||||||||||||
|---|---|---|---|---|---|---|---|---|---|---|---|---|---|---|---|---|---|---|---|---|---|---|---|---|---|---|---|---|---|---|---|---|---|---|---|---|---|---|---|
| Balance of goods and services | 390 | 363 | 89 | 91 | 93 | 83 | 79 | 107 | 123 | 130 | 110 | ||||||||||||||||||||||||||||
| Balance of income and current transfers | -18 | -1 | 10 | 10 | -11 | -16 | 16 | 10 | -22 | -7 | 7 | ||||||||||||||||||||||||||||
| Current account balance | 372 | 362 | 99 | 101 | 82 | 68 | 95 | 117 | 101 | 123 | 117 | ||||||||||||||||||||||||||||
| Capital transfers etc. to abroad, net | 1 | 1 | 0 | 0 | 0 | 1 | 0 | 0 | 0 | 0 | 1 | ||||||||||||||||||||||||||||
| Net lending | 371 | 361 | 99 | 101 | 82 | 67 | 95 | 117 | 101 | 123 | 116 | ||||||||||||||||||||||||||||
| Direct investment, net | 96 | 65 | 44 | -16 | 33 | 8 | 38 | -13 | 31 | 12 | 70 | ||||||||||||||||||||||||||||
| Portifolio investment, net | 480 | 130 | 178 | 161 | 1 | -57 | 180 | 5 | 133 | 80 | 166 | ||||||||||||||||||||||||||||
| Other investment, net | -319 | -21 | -161 | -106 | 20 | 130 | -193 | 22 | -66 | 31 | -121 | ||||||||||||||||||||||||||||
| Revaluations, net | -72 | -178 | 157 | -81 | -61 | -60 | -68 | 11 | -76 | -127 | 75 | ||||||||||||||||||||||||||||
| Increase in Norway`s net assets | 299 | 183 | 256 | 20 | 21 | 7 | 27 | 129 | 25 | -4 | 191 | ||||||||||||||||||||||||||||
Revised figures 2006 and 2007
The balance of payment figures for 2006 and 2007 are revised compared to the last publication. The main figures for 2006 are mainly revised down, whereas figures for 2007 are mostly revised up. For more information, see the table below.
| 2006 | 2007 | ||||||||||||||||||||||||||||||||||||||
|---|---|---|---|---|---|---|---|---|---|---|---|---|---|---|---|---|---|---|---|---|---|---|---|---|---|---|---|---|---|---|---|---|---|---|---|---|---|---|---|
| Balance of goods and services | -3 650 | 6 830 | |||||||||||||||||||||||||||||||||||||
| Balance of income and current transfers | 2 438 | 4 824 | |||||||||||||||||||||||||||||||||||||
| Current account balance | -1 212 | 11 654 | |||||||||||||||||||||||||||||||||||||
| Capital transfers etc. to abroad, net | 0 | 0 | |||||||||||||||||||||||||||||||||||||
Quarterly balance of payments data for the period 1994-2008 are available in StatBank Norway .
Fore more information about the external economy, use the following link External economy
Additional information
For more information about price and volume growth of exports and imports, see the quarterly national accounts.
More details about exports and imports of goods and services are available in the statistics on external trade in goods and services.
Contact
-
Håvard Sjølie
E-mail: havard.sjolie@ssb.no
tel.: (+47) 40 90 26 05
-
Linda Wietfeldt
E-mail: linda.wietfeldt@ssb.no
tel.: (+47) 40 90 25 48

