Content
Published:
This is an archived release.
NOK 83 billion in surplus
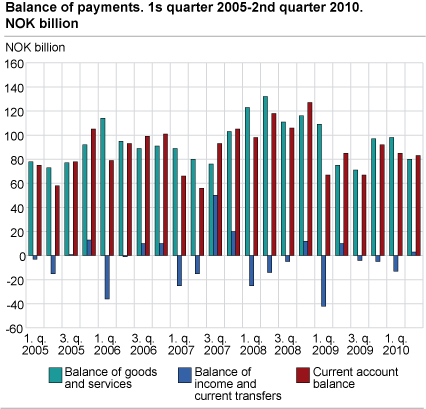
The current account surplus was estimated at NOK 83 billion in the second quarter of 2010. The result is NOK 2 billion lower than in the 1st quarter of 2010. The income and current transfers balance is also positive for the 2nd quarter.
Surplus on goods and services balance
The surplus on the goods and services balance was NOK 80 billion in the second quarter. This is NOK 18 billion lower than the first quarter of 2010. The decrease in the goods and services balance was mainly due to a higher import of goods. This was NOK 11 billion higher in the second compared to the first quarter, while service imports were just over NOK 3 billion higher. Meanwhile, exports of goods and services in the second quarter were about NOK 3 billion lower than in the previous quarter. The export value of goods was NOK 193 billion, which is NOK 9 billion lower than in the first quarter of 2010. Most of this is explained by a lower export value of oil and gas.
Large positive net dividend
The income and current transfers balance was estimated at NOK 2.8 billion in the second quarter, while there was a deficit of NOK 12.8 billion in the first quarter. Dividends from abroad increased by NOK14 billion, while the payment of dividends to foreign countries fell by NOK 10 billion. This played a large role in explaining the improvement. Higher interest payments pulled in the opposite direction.
Large direct investment and reduced portfolio investment abroad
Direct equity investment abroad in the second quarter of 2010 amounted to NOK 69 billon. The largest investment took place within the telecommunication and the oil extraction industries. In the same period, the banks sold securities to a value of NOK 25 billion, while the banks’ deposits abroad increased by NOK 142 billion (short-term deposits).
Both the banks and the mortgage companies raised large security loans in the second quarter of 2010, net NOK 30 and NOK 43 billion respectively.
Revisions
New information has provided revisions to the balance of payments for 2008, 2009, and the first quarter of 2010. For 2008 and 2009, the current account was adjusted downward, by respectively NOK 23 and NOK 25 billion. For the first quarter of 2010 the balance was adjusted downward by NOK 12 billion. The biggest revisions have been made to reinvested earnings and compensation of employees and investment income.
|
For more information about price and volume growth of exports and imports, see the quarterly national accounts . More details about exports and imports of goods are available in the statistics on external trade in goods . For more information on the external account, see the theme page . |
| 2008 | 2009 | 1. quarter 2008 | 2. quarter 2008 | 3. quarter 2008 | 4. quarter 2008 | 1. quarter 2009 | 2. quarter 2009 | 3. quarter 2009 | 4. quarter 2009 | 1. quarter 2010 | 2. quarter 2010 | ||||||||||||||||||||||||||||||||||||||||||||||||||||||||||||||||||||
|---|---|---|---|---|---|---|---|---|---|---|---|---|---|---|---|---|---|---|---|---|---|---|---|---|---|---|---|---|---|---|---|---|---|---|---|---|---|---|---|---|---|---|---|---|---|---|---|---|---|---|---|---|---|---|---|---|---|---|---|---|---|---|---|---|---|---|---|---|---|---|---|---|---|---|---|---|---|---|---|
| Balance of goods and services | 481 | 352 | 123 | 132 | 111 | 116 | 109 | 75 | 71 | 97 | 98 | 80 | |||||||||||||||||||||||||||||||||||||||||||||||||||||||||||||||||||
| Balance of income and current transfers | -32 | -41 | -25 | -14 | -5 | 12 | -42 | 10 | -4 | -5 | -13 | 3 | |||||||||||||||||||||||||||||||||||||||||||||||||||||||||||||||||||
| Current account balance | 449 | 312 | 98 | 118 | 106 | 127 | 67 | 85 | 67 | 92 | 85 | 83 | |||||||||||||||||||||||||||||||||||||||||||||||||||||||||||||||||||
| Capital transfers etc. to abroad, net | 1 | 1 | 0 | 0 | 1 | 0 | 0 | 1 | 0 | 0 | 1 | 0 | |||||||||||||||||||||||||||||||||||||||||||||||||||||||||||||||||||
| Net lending | 448 | 311 | 98 | 118 | 105 | 127 | 67 | 85 | 67 | 92 | 84 | 83 | |||||||||||||||||||||||||||||||||||||||||||||||||||||||||||||||||||
| Direct investment, net | 86 | 115 | 20 | 28 | 35 | 3 | 4 | 13 | 71 | 27 | 52 | 23 | |||||||||||||||||||||||||||||||||||||||||||||||||||||||||||||||||||
| Portifolio investment, net | 645 | 14 | 135 | 77 | 209 | 224 | 83 | 48 | 17 | -135 | 21 | -55 | |||||||||||||||||||||||||||||||||||||||||||||||||||||||||||||||||||
| Other investment, net | -323 | 350 | -68 | 24 | -124 | -155 | 5 | 102 | 25 | 217 | 3 | 150 | |||||||||||||||||||||||||||||||||||||||||||||||||||||||||||||||||||
| Revaluations, net | -164 | 28 | -87 | -115 | 81 | -44 | -241 | 218 | 136 | -85 | 84 | -15 | |||||||||||||||||||||||||||||||||||||||||||||||||||||||||||||||||||
| Increase in Norway`s net assets | 284 | 338 | 11 | 3 | 186 | 84 | -174 | 303 | 203 | 6 | 168 | 68 | |||||||||||||||||||||||||||||||||||||||||||||||||||||||||||||||||||
| 2008 | 2009 | ||||||||||||||||||||||||||||||||||||||||||||||||||||||||||||||||||||||||||||||
|---|---|---|---|---|---|---|---|---|---|---|---|---|---|---|---|---|---|---|---|---|---|---|---|---|---|---|---|---|---|---|---|---|---|---|---|---|---|---|---|---|---|---|---|---|---|---|---|---|---|---|---|---|---|---|---|---|---|---|---|---|---|---|---|---|---|---|---|---|---|---|---|---|---|---|---|---|---|---|---|
| Balance of goods and services | -1.3 | - | |||||||||||||||||||||||||||||||||||||||||||||||||||||||||||||||||||||||||||||
| Current account balance | -5.5 | -8.0 | |||||||||||||||||||||||||||||||||||||||||||||||||||||||||||||||||||||||||||||
Additional information
For more information about price and volume growth of exports and imports, see the quarterly national accounts.
More details about exports and imports of goods and services are available in the statistics on external trade in goods and services.
Contact
-
Håvard Sjølie
E-mail: havard.sjolie@ssb.no
tel.: (+47) 40 90 26 05
-
Linda Wietfeldt
E-mail: linda.wietfeldt@ssb.no
tel.: (+47) 40 90 25 48

