Content
Published:
This is an archived release.
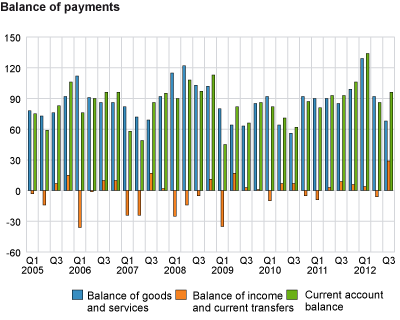
NOK 96 billion in current account surplus
The surplus on the current account was NOK 10 billion higher in the third quarter of 2012 compared to the second quarter. A strong income and transfer balance pulled the current account in a positive direction in the third quarter. Altogether, the surplus on the current account was NOK 316 billion in the first three quarters of 2012.
The result for the three quarters was NOK 48 billion higher than in the same period in 2011.
Surplus reduction on goods and services
The value of exports of crude oil and natural gas declined by NOK 18 billion from the second to the third quarter for 2012. The decline was mainly due to a lower extraction rate in conjunction with maintenance work and technological difficulties on the Norwegian shelf. Imports of goods were NOK 3 billion lower in the third quarter compared to the second quarter. However, in the first three quarters of 2012 the balance of goods was NOK 35 billion higher than the same period in 2011.
The services balance showed a considerable deficit of NOK 14 billion in the third quarter. The deficit declined by NOK 9 billion compared to the second quarter. This must be seen in conjunction with higher travel expenses abroad in the third quarter.
Strong surplus on income and transfer balance
The surplus on the income and transfers balance was NOK 29 billion in the third quarter compared to a deficit of NOK 6 billion in the second quarter. This can be explained mostly by the sharp fall in dividends paid to the rest of the world.
Large transactions in portfolio investment abroad
The Norwegian portfolio investment abroad in the third quarter of 2012 amounted to NOK 150 billion and to NOK 354 billion in the period of the first to the third quarter of 2012. The amounts were NOK 23 billion and NOK 82 billion higher respectively than in the same periods in 2011. Most of the investment was made by the Government Pension Fund Global and the investment in equity securities was larger than the investment in debt securities as it has been since the first quarter of 2011.
The foreign direct investment in Norway in equity capital in the third quarter was considerable but in the three first quarters of 2012 the investment was still negative. This fact was contrary to the Norwegian foreign direct investment abroad, which was small in the third quarter but large in 2012 so far.
| 2010 | 2011 | Q4 2010 | Q1 2011 | Q2 2011 | Q3 2011 | Q4 2011 | Q1 2012 | Q2 2012 | Q3 2012 | ||||||||||||||||||||||||||||||||||||||||||||||||||||||||||||||||||||||
|---|---|---|---|---|---|---|---|---|---|---|---|---|---|---|---|---|---|---|---|---|---|---|---|---|---|---|---|---|---|---|---|---|---|---|---|---|---|---|---|---|---|---|---|---|---|---|---|---|---|---|---|---|---|---|---|---|---|---|---|---|---|---|---|---|---|---|---|---|---|---|---|---|---|---|---|---|---|---|---|
| Balance of goods and services | 304 | 365 | 92 | 90 | 90 | 85 | 99 | 129 | 92 | 68 | |||||||||||||||||||||||||||||||||||||||||||||||||||||||||||||||||||||
| Balance of income and current transfers | 0 | 9 | -5 | -9 | 3 | 9 | 6 | 4 | -6 | 29 | |||||||||||||||||||||||||||||||||||||||||||||||||||||||||||||||||||||
| Current account balance | 303 | 374 | 87 | 81 | 93 | 93 | 106 | 134 | 86 | 96 | |||||||||||||||||||||||||||||||||||||||||||||||||||||||||||||||||||||
| Capital transfers etc. to abroad, net | 1 | 1 | 0 | 0 | 0 | 0 | 1 | 1 | 0 | 0 | |||||||||||||||||||||||||||||||||||||||||||||||||||||||||||||||||||||
| Net lending | 302 | 373 | 87 | 81 | 93 | 93 | 105 | 133 | 86 | 96 | |||||||||||||||||||||||||||||||||||||||||||||||||||||||||||||||||||||
| Direct investment, net | 39 | 68 | -27 | 57 | 12 | 36 | -37 | 38 | 34 | 8 | |||||||||||||||||||||||||||||||||||||||||||||||||||||||||||||||||||||
| Portifolio investment, net | 96 | 249 | 28 | 25 | 77 | 79 | 67 | -11 | 39 | 150 | |||||||||||||||||||||||||||||||||||||||||||||||||||||||||||||||||||||
| Other investment, net | 91 | 171 | -5 | 37 | 38 | 47 | 49 | 71 | 22 | -66 | |||||||||||||||||||||||||||||||||||||||||||||||||||||||||||||||||||||
| Revaluations, net | 125 | -183 | 48 | -49 | -49 | -195 | 109 | 80 | -31 | 25 | |||||||||||||||||||||||||||||||||||||||||||||||||||||||||||||||||||||
| Increase in Norway`s net assets | 427 | 190 | 135 | 33 | 44 | -102 | 214 | 213 | 54 | 121 | |||||||||||||||||||||||||||||||||||||||||||||||||||||||||||||||||||||
RevisionsThe quarterly figures have been revised back to 2005. When compiling figures for the third quarter, final annual figures for 2010 from annual national accounts have been incorporated into the quarterly balance of payments. This has led to revisions on the 2010 figures, and subsequently on 2011 and 2012 data series. In 2009, a revision of the value of exports of natural gas led to an increase in the exports of goods worth NOK 25 billion. From 2005 to 2008, the revisions only entail marginal changes in the balance of income and current transfers. |
|
For more information about price and volume growth of exports and imports, see the quarterly national accounts . More details about exports and imports of goods are available in the statistics on external trade in goods . |
Additional information
For more information about price and volume growth of exports and imports, see the quarterly national accounts.
More details about exports and imports of goods and services are available in the statistics on external trade in goods and services.
Contact
-
Håvard Sjølie
E-mail: havard.sjolie@ssb.no
tel.: (+47) 40 90 26 05
-
Linda Wietfeldt
E-mail: linda.wietfeldt@ssb.no
tel.: (+47) 40 90 25 48

