Content
About the statistics
Definitions
-
Name and topic
-
Name: Other service statistics, structural business statistics
Topic: Wholesale and retail trade and service activities
-
Responsible division
-
Division for Structural Business Statistics
-
Definitions of the main concepts and variables
-
Enterprise
In the Standard Industrial Classification (SIC) an enterprise is the smallest combination of legal entities that is an organizational unit producing goods or services, which benefits from a certain degree of autonomy in decision making.
Owners
Owners include owners of sole proprietorships, or general partnerships, and family members who work for the enterprise on a daily basis without receiving regular wages. Co-owners of limited companies and cooperatives who are paid for working for the enterprise are not included, nor are family members of owners of sole proprietorships or general partnerships when they receive regular wages.
Employees
The number of employees is mainly obtained from the Register of Employees and Employers (the Aa-Register), see section 3.6. An employee is a person that works for an employer and receive compensation in the form of wages, pay, fee, bonuses, payment in kind etc. There are conditions that the work should last for at least six days and that the employee must be employed on average four or more hours a week for the employee to be notifiable to the Aa-register. The number of employees in the structural statistics shows an average of the number that has been employed throughout the year.
Employment
Employment is the sum of owners and employees. Compared to the Registerbased Employment Statistics (http://www.ssb.no/regsys_en/), where persons are counted only in the main industry where they are employed, the structural statistics allows persons with more than one job to be counted as employee in several industries at the same time. The statistics on employment will therefore not be directly comparable.
Employment statistics show the average number of persons employed in the year.
Man-years
The figures include the number of man-years worked by the employees in an enterprise.Turnover/sales
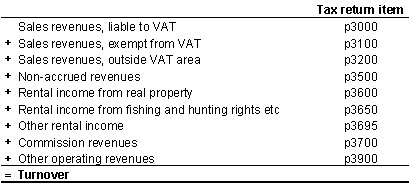
Turnover is defined as the sum of remuneration for rendering of services to customers and sales of merchandise, and gross income from other activities. Rental income, commissions and special taxes are included, while subsidies and profits from sales of business assets are not. VAT is not included in the statistics.
Merchandise
Merchandise is goods bought and resold with no added value.Compensation of employees
Compensation of employees includes wages, holiday pay, fees, etc., employer's national insurance contribution, reportable pension costs and other personnel costs. Compensation of employees does not include remuneration to owners of sole proprietorships or partnerships or to family members without regular wages.Production value
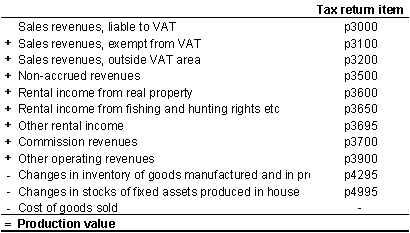
Production value means sales corrected for changes in stocks of finished goods, work in progress, and goods and services purchased for resale. Purchases of goods and services for resale are deducted, while capitalized own investment work is added.
Value added
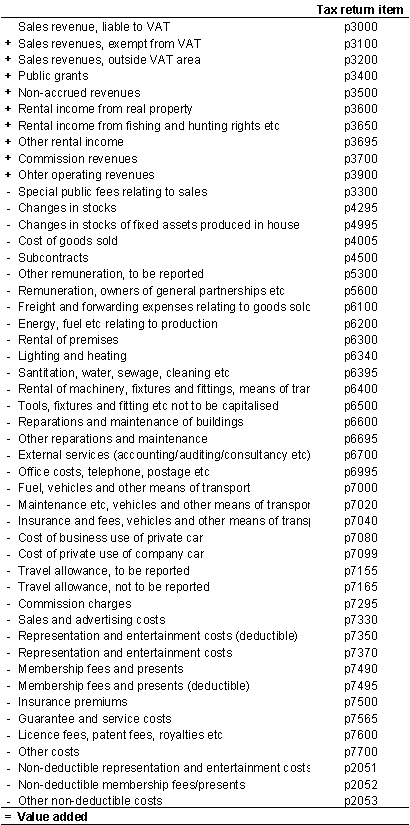
Value added is figured as the sum of production value less the purchase of goods and services (for other goods and services than those purchased for resale) and special public taxes, and corrected for changes in stocks of raw materials and consumer goods. Special public subsidies for manufactured/sold merchandise and other public subsidies/reimbursements are included.
Gross investments
Gross investments are the total value of new capital goods such as buildings and plant, machinery, tools, implements, software, vehicles (except for personal use), both new and used. Improvements are added while sales of used capital stock are deducted. Investment figures are minus incoming value added tax.Acquisitions
This includes investments in new assets and improvements of own assets.New investments include all newly acquired fixed assets acquired and completed in the course of the year, excluding investments in unimproved property. In assessing the value of the business asset, cost price is used for purchases and production cost for own manufactures. Acquisitions through financial leasing are included when the asset is entered as an asset in the balance sheet.
Improvement of own assets includes the value of all capitalized improvements and major repairs purchased and executed by others and/or undertaken by own employees on own business assets. A precondition is that such improvements increase the efficiency/value of and/or prolong the lifetime of the business asset. The improvement is estimated at purchase price at time of purchase or at production cost when it is manufactured.
Sale of business assets
Sale of business assets is estimated at the sales value (replacement value) upon realization of used business assets over the course of the year. The amount includes investment tax. The business asset is regarded as sold when it is delivered.
-
Standard classifications
-
The Standard Industrial Classification (SN2002) used in Statistics Norway is based on the EU Standard NACE Rev. 2: http://www.ssb.no/nace
Administrative information
-
Regional level
-
National level
-
Frequency and timeliness
-
Frequency: Annual
Timeliness: The statistics should be published within 10 months from the end of the reference period
-
International reporting
-
The statistics are reported to EUROSTAT
-
Microdata
-
Primary data and information on sample units and population are stored temporarily in the programming language SAS, and stored permanently as text-files.
Background
-
Background and purpose
-
The structural business statistics for other serivice activities are a part of the industrial statistics of Statistics Norway, and present detailed information about the activities in this sector on the basis of financial information. The statistics were first published in 1995.
-
Users and applications
-
Users include public and private sector agencies, private organizations, individuals and international organizations such as EUROSTAT, as well as the National Accounts and other divisions of Statistics Norway.
-
Equal treatment of users
-
No external users have access to the statistics and analyses before they are published and accessible simultaneously for all users on ssb.no at 8 am. Prior to this, a minimum of three months' advance notice is given inthe Statistics Release Calendar. This is one of Statistics Norway's key principles for ensuring that all users are treated equally
-
Coherence with other statistics
-
The structural statistics on construction activities are a part of Statistics Norway industrial statistics covering most industries.
The employment figures in the structural business statistics are not directly comparable with the registerbased employment statistics. The structural business statistics shows for example an average of number of employees through the year, while the registerbased employment statistics shows the number of employees in the 4. quarter. A definition of employment is given in section 4.1.
-
Legal authority
-
Statistics Act Sections 2-2, 2-3 and 3-2.
-
EEA reference
-
Rådsforordning (EC) No. 295/2008 of the European Parliament
Production
-
Population
-
The structural statistics for other service activities are organized according to the NACE-standard (see section 4.2) and include the following industry division:
95 Repair of computers and personal household goods
96 Other personal service activities
The structural business statistics comprise most of the enterprises that are registered in the abovementioned industry division, as long as the enterprise was registered with activity in Norway in the relevant statistical year.
Enterprises within industry division 94 Activities of Membership Organizations are not included in Structural business statistics, personal services.
Preliminary figures are only published on 3-digit NACE-level.
-
Data sources and sampling
-
For a sample of the enterprises in the population, including all enterprises with more than one local kind-of-activity unit (local KAU), the statistics are based on Trading Statements (NO) and a supplementary questionnaire. The Trading Statements are either attached to the questionnaires or submitted electronically via the Norwegian Internal Revenue Service.
Information, like the accounts and turnover, about the enterprises with only one local KAU outside the sample is obtained from the following sources:
trading statements (NO) electronically submitted via the Norwegian Internal Revenue Service the Register of Annual Company Reports in Brønnøysund the VAT Register
From the statistical year 2015 the number of employees is collected via A-ordningen, where employers are obligated to submit monthly reports for everyone who receives wages and salaries. Previously, these figures were collected through the register of Employers and Employees. These two sources are not directly comparable.
The Central Register of Establishments and Enterprises is used to obtain necessary information about the population. The VAT Register, the Central Coordinating Register for Legal Entities, information from trade organizations and direct input from the enterprises are used to update the Central Register of Establishments and Enterprises.
The population consists of all enterprises in the relevant industry divisions with registered activity in the reference year. The population is divided into subpopulations, called strata, after criteria like industrial classification and number of employees. In some of the strata, all enterprises are always included in the sample. From the remaining strata, a representative selection of enterprises is drawn. All enterprises in this sample are asked to report a full set of Trading Statements and to complete a questionnaire.
This detailed survey of accounting data is combined with the additional information from the various registers and the structural survey of Statistics Norway to form the basis for the estimation of the financial structures of the different industries and the sector as a whole.
-
Collection of data, editing and estimations
-
A complete set of statements (NO with supplementary forms) is obtained from a sample of enterprises. The supplementary forms are collected by postal questionnaires, and it is possible to report data on the Internet. The questionnaires are sent out in April/May after the end of the statistical year, with a response deadline of four or five weeks. The enterprises that do not respond on the first letter will be given reminders in writing for about a further six months from the first deadline. Failure to respond is subject to fines.
For the other enterprises, sales figures and other essential accounting data were obtained from Trading Statements (NO) submitted electronically via the Norwegian Internal Revenue Service or from annual accounts in the Register of Annual Company Reports in Brønnøysund. Sales figures were furthermore obtained from enterprises in the "VAT Register".
Enterprises do not deliver information to the sources mentioned above, will receive a questionnaire with a question about this.
Revisions and corrections are carried out on the information obtained from the sample population and the structural survey. The raw data are checked against reports for last year, the Central Register of Establishments and Enterprises, the Register of Annual Company Reports in Brønnøysund and other available sources, and by contacting the respondent if necessary.
The preliminary figures are not as thoroughly revised as the final figures.
For the enterprises where a complete NO with supplementary form exists, no variables are estimated. For these enterprises the information in the forms are used.
For enterprises outside the sample that submit Trading Statements electronically, only data for the supplementary forms was estimated. Afterwards we used the existing data from the annual accounts according to the Register of Annual Company Accounts and split them up into respective sub items according to the relative shares shown in the data from the NO sample. We subsequently took data according the "VAT Register" into account in the statistical calculation.
The other items are estimated according to the division in the sample (organized by subclass and same size groups with respect to turnover, operating expenditure or other relevant distribution keys).
Enterprises with sales according to the VAT Register
The NO items are estimated with sales as a key for the enterprises outside the sample where sales are obtained from the "VAT Register".
Employment figures
Employment figures for the enterprises are mainly obtained via A-ordningen), but some are estimated on the basis of the enterprises’ wage costs or turnover. The Employment figures are revised, based on information from other sources, before dissemination.
-
Seasonal adjustment
-
Not relevant
-
Confidentiality
-
If less than three enterprises/ Local KAUs represents a statistical variable, the numbers are not published. The reason is the risk that the units can be identified. This is especially critical when regional data are published.
-
Comparability over time and space
-
Preliminary figures are published while data are still under revision, and may therefore deviate from the final figures that are published within 18 months of the end of the reference year. Preliminary data for the enterprises in the sample that has not yet responded at the time of publishing are estimated by using other sources.
Generally, when making comparisons with previously published figures it must be kept in mind that older data may have been corrected during later revisions. Updating of industries in the Central Register of Establishments and Enterprises may also have caused revisions for some of the industries. These changes have not been dated back.
From the statistical year 2015 the number of employees is collected via A-ordningen, Previously, these figures were collected through the register of Employers and Employees. These two sources are not directly comparable.
Accuracy and reliability
-
Sources of error and uncertainty
-
Returned questionnaires are read optically and automatically checked. An optical image of the form is first saved electronically and then checked manually in order to ensure that the primary data are as correct as possible. Nevertheless, the results of a statistical survey may contain some measurement and processing errors.
Measurement errors occur when the provider of the data gives incorrect answers due to forgetfulness, misunderstanding of questions etc.
Processing errors are errors from coding or errors that occur during the transferring of information from the questionnaire to a machine-readable medium or during revisions.
Non-response, that is when the respondent does not return the form or returns the form with incomplete information, will always be an aspect of form-based surveys. In the structural business statistics, non-respondent enterprises are treated the same way as enterprises outside the sample population.
Not relevant. Preliminary figures are a full census.
In the structural business statistics, the Central Register of Establishments and Enterprises, the Register of Annual Company Reports in Brønnøysund, the VAT Register and the Register of Employees and Employers (the Aa-Register) are used in order to define the population and help collect the necessary data.
Errors in these administrative registers - like time gaps in registration, incorrectly identified unit characteristics etc. may therefore be a potential source of uncertainty in the statistics and may for instance have an impact when dividing the population into adequate strata.
-
Revision
-
Not relevant
The statistics is now published as Business statistics.
Additional information
Preliminary figures have fewer variables than final figures and are only published at enterprise level.
