Errors have been discovered in the import value of firewood in the period 2024. See (article link). The reason is incorrect use of commodity numbers when customs clearance of goods. The figures will be corrected in StatBank when published on 15 May 2025.
For more information, see the article Korrigerte tall for import av ved.
Statistikk innhold
Statistics about
External trade in goods
The external trade statistics comprise the development in Norway's trade with other countries in terms of value and volume figures. Aggregated as well as detailed imports and exports figures between Norway and partner countries, trade regions and continents are provided.
Selected figures from this statistics
- External trade in goods. Month and so far this yearDownload table as ...External trade in goods. Month and so far this year1
NOK Billion Change in per cent NOK Billion - so far this year Change in per cent - so far this year February 2025 January 2025 - February 2025 February 2024 - February 2025 February 2025 February 2024 - February 2025 Exports 169.8 -4.3 29.1 347.3 24.2 Crude oil 40.3 -11.9 1.3 86.0 1.4 Natural gas 64.2 -7.2 85.4 133.4 69.2 Ships and oil platforms 0.0 . -100.0 0.0 -100.0 Mainland exports 64.8 4.0 15.6 127.1 10.9 Fish, crustaceans, molluscs and prep. thereof 13.6 -7.4 7.2 28.2 10.5 Imports 85.2 2.2 8.7 168.5 5.1 Ships and oil platforms 0.0 -50.0 -94.8 0.1 -98.0 The trade balance 84.7 -10.0 59.2 178.8 49.8 The mainland trade balance -20.3 3.0 6.6 -41.3 -0.1 1Due to the data collection method, the preliminary monthly figures published for ships and oil platforms are often incomplete. In retrospect, therefore, the trade in these goods could in some cases lead to major corrections in the figures. Explanation of symbolsDownload table as ... - Imports of goods, main groups by SITC. Month and so far this yearDownload table as ...Imports of goods, main groups by SITC. Month and so far this year1
NOK Million Change in per cent NOK Million Change in per cent February 2024 February 2025 February 2024 -February 2025 So far this year February 2024 -February 2025 February 2024 February 2025 Total 78 364 85 163 8.7 160 283 168 513 5.1 Of which: Ships and oil platforms (part of SITC 793) 554 29 -94.8 4 403 88 -98.0 Imports excl. Ships and oil platforms 77 809 85 133 9.4 155 881 168 425 8.0 0 Food and live animals 5 907 6 411 8.5 12 339 13 767 11.6 00 Live animals other than animals of div.03 17 16 -4.4 27 32 19.0 01 Meat and meat preparations 141 155 9.6 314 323 3.1 02 Dairy products and birds' eggs 229 219 -4.0 439 450 2.5 03 Fish, crustaceans, molluscs and prep. thereof 628 499 -20.6 1 531 1 719 12.3 04 Cereals and cereal preparations 956 849 -11.2 1 834 1 692 -7.8 05 Vegetables and fruit 1 512 1 716 13.5 3 031 3 377 11.4 06 Sugars, sugar prepatations and honey 270 253 -6.4 532 513 -3.6 07 Coffee, tea, cocoa, spices 534 857 60.7 1 155 1 828 58.3 08 Feeding stuff for animals (not cereals) 984 1 088 10.6 2 176 2 335 7.3 09 Miscellaneous edible products 637 760 19.3 1 301 1 498 15.2 1 Beverages and tobacco 1 301 1 184 -9.0 2 321 2 291 -1.3 11 Beverages 803 835 4.0 1 474 1 566 6.2 12 Tobacco and tobacco manufactures 498 348 -30.1 847 725 -14.4 2 Crude materials, inedible, except fuels 4 503 5 558 23.4 9 456 12 524 32.4 21 Hides, skins and furskins, raw 10 3 -66.7 15 8 -43.4 22 Oil seeds and oleaginous fruits 270 261 -3.3 519 682 31.3 23 Crude rubber 7 7 1.5 14 16 21.3 24 Wood, lumber and cork 418 454 8.7 836 908 8.6 25 Pulp and waste paper 51 51 -1.5 148 108 -27.3 26 Textile fibres and their waste 17 20 20.6 30 35 17.2 27 Crude fertilizers and crude minerales 748 575 -23.2 1 339 1 205 -10.0 28 Metalliferous ores and metal scrap 2 681 3 788 41.3 6 002 8 831 47.1 29 Crude animal and vegetable materials 302 400 32.4 553 729 32.0 3 Mineral fuels, lubricants and related materials 4 910 4 161 -15.3 10 903 9 572 -12.2 32 Coal, coke and briquettes 324 284 -12.5 699 746 6.6 33 Petroleum, petroleum products 3 818 3 323 -13.0 8 215 7 817 -4.8 334 Petroleum oils and oils obtained from bituminous minerals (other than crude); preparations, n.e.s., containing by weight 70% or more of petroleum oils or of oils obtained from bituminous minerals, these oils being the basic constituents of the preparation 3 528 2 225 -36.9 6 645 5 583 -16.0 34 Gas , natural and manufactured 102 291 185.0 243 465 91.1 342 Liquefied propane and butane 80 270 236.3 164 358 117.8 35 Electric current 666 262 -60.6 1 745 545 -68.8 4 Animal and vegetable oils, fats and waxes 1 420 918 -35.4 2 488 2 502 0.6 41 Animal oils and fats 889 230 -74.1 1 416 1 077 -24.0 42 Fixed vegetable fats and oils, crude, refined or fractionated 503 549 9.2 964 1 166 21.0 43 Animal or vegetable fats and oils, processed 29 140 387.6 108 259 138.9 5 Chemicals and related products n.e.s. 9 716 9 373 -3.5 19 149 18 420 -3.8 51 Organic chemicals 1 094 1 029 -6.0 2 367 2 146 -9.3 52 Inorganic chemicals 828 1 162 40.3 1 906 1 933 1.4 53 Dyeing, tanning and colouring materials 353 409 15.9 687 765 11.3 54 Medicinal and pharmaceutical products 2 889 2 703 -6.4 5 748 5 555 -3.4 55 Essential oils and resinoids etc 1 179 1 235 4.7 2 367 2 437 2.9 56 Fertilizers 470 476 1.2 800 725 -9.3 57 Plastics in primary forms 557 579 4.1 1 061 1 153 8.7 58 Plastics in non-primary forms 705 707 0.2 1 332 1 374 3.1 59 Chemical materials and products, n.e.s. 1 640 1 073 -34.6 2 881 2 333 -19.0 6 Manufactured goods classified chiefly by material 11 041 12 061 9.2 21 134 22 965 8.7 61 Leather, leather manufactures, furskins 54 24 -55.4 98 53 -46.1 62 Rubber manufactures, n.e.s. 684 694 1.4 1 193 1 316 10.3 63 Cork and wood manufactures 697 742 6.5 1 380 1 457 5.5 64 Paper, paperboard and manufactures thereof 862 854 -0.8 1 745 1 778 1.9 65 Textile yarn, fabrics, made-up articles 872 927 6.4 1 678 1 832 9.2 66 Non-metallic mineral manufactures, n.e.s. 980 1 000 2.0 1 838 2 062 12.2 67 Iron and steel 2 118 2 724 28.6 4 489 5 042 12.3 68 Non-ferrous metals 1 116 1 112 -0.3 2 110 2 163 2.5 69 Manufactures of metals, n.e.s. 3 658 3 984 8.9 6 602 7 261 10.0 7 Machinery and transport equipment 28 544 33 025 15.7 60 972 62 332 2.2 71 Power generating machinery and equipment 1 596 1 962 22.9 3 265 3 628 11.1 72 Machinery for special industries 3 463 2 812 -18.8 6 109 5 230 -14.4 73 Metal working machinery 236 264 11.7 540 492 -8.9 74 General industrial machinery and equipment 4 669 5 176 10.9 8 680 9 579 10.4 75 Office machines, data processing machines 1 854 3 150 70.0 5 191 6 096 17.4 76 Telecommunications apparatus and equipment 2 555 2 988 16.9 5 732 6 305 10.0 77 Electrical machinery and apparatus 5 306 5 666 6.8 10 311 11 282 9.4 78 Road vehicles 7 285 7 597 4.3 13 164 14 863 12.9 781 Motor cars and other motor vehicles principally designed for the transport of persons 3 511 3 601 2.5 5 872 7 613 29.7 79 Other transport equipment including ships 1 580 3 411 115.9 7 981 4 856 -39.2 8 Miscellaneous manufactured articles 10 882 12 297 13.0 21 278 23 784 11.8 81 Prefabricated buildings 824 772 -6.3 1 475 1 474 -0.1 82 Furniture and parts thereof 1 528 1 670 9.3 2 921 3 219 10.2 83 Travel goods, handbags etc. 253 238 -5.7 465 492 5.9 84 Articles of apparel and accessories 2 200 2 312 5.1 4 437 4 827 8.8 85 Footwear 582 670 15.0 1 126 1 313 16.6 87 Professional and scientific instruments 2 034 2 188 7.5 3 995 4 279 7.1 88 Photographic and optical goods 374 415 11.0 707 838 18.6 89 Miscellaneous manufactured articles, n.e.s 3 087 4 033 30.6 6 152 7 341 19.3 9 Other commodities and transactions 140 175 25.3 244 357 46.2 91 Postal packages not classified according to kind 0 0 . 0 0 . 93 Special transactions and commodities not classified according to kind 68 72 5.8 125 143 13.9 96 Coin (other than gold coin), not being legal tender 5 5 1.7 5 6 21.1 97 Gold, non-monetary (excluding gold, ores and concentrates) 67 99 46.5 113 208 83.0 1Standard International Trade Classification, Revision 4 (SITC, Rev. 4) Explanation of symbolsDownload table as ... - Exports of goods, main groups by SITC. Month and so far this yearDownload table as ...Exports of goods, main groups by SITC. Month and so far this year1
NOK Million Change in per cent NOK Million Change in per cent February 2024 February 2025 February 2024 -February 2025 So far this year February 2024 -February 2025 February 2024 February 2025 Total 131 559 169 824 29.1 279 613 347 287 24.2 Of which: Crude oil (part of SITC 333) 39 736 40 263 1.3 84 775 85 968 1.4 Natural gas (SITC 343) 34 643 64 222 85.4 78 863 133 398 69.2 Natural gas condensates (part of SITC 333) 471 543 15.3 703 801 13.9 Ships and oil platforms (part of SITC 793) 666 0 -100.0 666 0 -100.0 Mainland exports 56 042 64 796 15.6 114 606 127 121 10.9 0 Food and live animals 13 513 14 557 7.7 27 326 30 131 10.3 00 Live animals other than animals of div.03 4 12 198.2 9 20 106.9 01 Meat and meat preparations 32 37 17.4 61 74 21.3 02 Dairy products and birds' eggs 28 21 -26.6 44 42 -3.9 03 Fish, crustaceans, molluscs and prep. thereof 12 666 13 578 7.2 25 552 28 234 10.5 04 Cereals and cereal preparations 82 91 11.2 152 181 18.8 05 Vegetables and fruit 26 28 7.9 46 54 16.1 06 Sugars, sugar prepatations and honey 5 2 -50.3 10 8 -16.0 07 Coffee, tea, cocoa, spices 50 57 13.4 104 114 9.7 08 Feeding stuff for animals (not cereals) 347 393 13.1 783 767 -2.0 09 Miscellaneous edible products 272 338 24.1 565 637 12.8 1 Beverages and tobacco 127 89 -30.3 212 197 -6.7 11 Beverages 125 88 -29.5 209 195 -6.8 12 Tobacco and tobacco manufactures 2 0 -91.0 3 3 -0.1 2 Crude materials, inedible, except fuels 2 562 2 535 -1.1 4 819 5 125 6.4 21 Hides, skins and furskins, raw 42 28 -33.7 91 56 -37.7 22 Oil seeds and oleaginous fruits 0 1 597.9 1 2 36.8 23 Crude rubber 6 4 -38.2 10 11 12.1 24 Wood, lumber and cork 652 785 20.5 1 223 1 519 24.2 25 Pulp and waste paper 402 375 -6.5 774 766 -1.1 26 Textile fibres and their waste 21 23 8.8 44 50 14.3 27 Crude fertilizers and crude minerales 459 435 -5.1 856 874 2.0 28 Metalliferous ores and metal scrap 913 848 -7.1 1 711 1 768 3.4 29 Crude animal and vegetable materials 67 35 -47.8 109 80 -26.7 3 Mineral fuels, lubricants and related materials 83 095 114 724 38.1 182 838 239 305 30.9 32 Coal, coke and briquettes 0 0 . 1 0 -97.7 33 Petroleum, petroleum products 44 885 45 367 1.1 96 276 95 985 -0.3 334 Petroleum oils and oils obtained from bituminous minerals (other than crude); preparations, n.e.s., containing by weight 70% or more of petroleum oils or of oils obtained from bituminous minerals, these oils being the basic constituents of the preparation 4 644 4 527 -2.5 10 709 9 113 -14.9 34 Gas , natural and manufactured 36 635 66 122 80.5 83 270 137 369 65.0 342 Liquefied propane and butane 1 774 1 683 -5.1 4 033 3 660 -9.2 35 Electric current 1 575 3 235 105.4 3 291 5 951 80.9 4 Animal and vegetable oils, fats and waxes 492 439 -10.8 944 972 2.9 41 Animal oils and fats 269 206 -23.4 497 399 -19.6 42 Fixed vegetable fats and oils, crude, refined or fractionated 43 103 141.5 113 202 79.0 43 Animal or vegetable fats and oils, processed 181 131 -27.9 335 370 10.7 5 Chemicals and related products n.e.s. 6 752 6 867 1.7 13 931 14 717 5.6 51 Organic chemicals 1 130 1 401 23.9 2 503 3 124 24.8 52 Inorganic chemicals 1 022 1 079 5.6 2 064 2 031 -1.6 53 Dyeing, tanning and colouring materials 176 252 43.1 362 475 31.3 54 Medicinal and pharmaceutical products 1 306 1 086 -16.8 2 655 2 266 -14.7 55 Essential oils and resinoids etc 230 287 24.8 467 596 27.7 56 Fertilizers2 : : : : : : 57 Plastics in primary forms 737 647 -12.2 1 464 1 459 -0.4 58 Plastics in non-primary forms 217 159 -26.5 386 330 -14.6 59 Chemical materials and products, n.e.s. 1 935 1 957 1.1 4 030 4 436 10.1 6 Manufactured goods classified chiefly by material 10 458 11 459 9.6 21 680 22 982 6.0 61 Leather, leather manufactures, furskins 12 8 -34.2 24 18 -26.3 62 Rubber manufactures, n.e.s. 92 113 23.5 234 217 -7.3 63 Cork and wood manufactures 210 231 10.1 397 480 20.9 64 Paper, paperboard and manufactures thereof 543 582 7.2 1 090 1 261 15.7 65 Textile yarn, fabrics, made-up articles 253 226 -10.7 498 475 -4.6 66 Non-metallic mineral manufactures, n.e.s. 209 208 -0.5 443 430 -2.9 67 Iron and steel 2 028 1 530 -24.6 3 892 3 372 -13.4 68 Non-ferrous metals 6 179 7 692 24.5 13 324 14 802 11.1 69 Manufactures of metals, n.e.s. 932 867 -6.9 1 777 1 926 8.4 7 Machinery and transport equipment 10 971 14 893 35.7 20 797 25 378 22.0 71 Power generating machinery and equipment 1 337 1 123 -16.0 2 166 2 037 -5.9 72 Machinery for special industries 1 203 1 264 5.0 2 390 2 683 12.3 73 Metal working machinery 58 69 19.7 161 138 -14.4 74 General industrial machinery and equipment 2 610 2 232 -14.5 5 087 4 647 -8.6 75 Office machines, data processing machines 539 383 -29.1 1 068 762 -28.7 76 Telecommunications apparatus and equipment 819 1 054 28.7 1 546 1 994 29.0 77 Electrical machinery and apparatus 1 995 2 950 47.8 4 076 5 055 24.0 78 Road vehicles 1 159 1 264 9.1 2 379 2 540 6.8 79 Other transport equipment including ships 1 250 4 554 264.2 1 924 5 522 187.0 8 Miscellaneous manufactured articles 3 410 3 927 15.2 6 755 7 972 18.0 81 Prefabricated buildings 191 178 -6.7 401 427 6.6 82 Furniture and parts thereof 305 345 13.3 603 646 7.2 83 Travel goods, handbags etc. 21 19 -13.1 43 42 -0.1 84 Articles of apparel and accessories 252 219 -13.0 521 500 -4.0 85 Footwear 65 62 -3.9 139 147 5.9 87 Professional and scientific instruments 1 536 1 632 6.3 3 008 3 209 6.7 88 Photographic and optical goods 48 26 -45.4 78 64 -17.9 89 Miscellaneous manufactured articles, n.e.s 992 1 445 45.7 1 963 2 935 49.5 9 Other commodities and transactions 179 334 86.4 311 509 63.7 91 Postal packages not classified according to kind 0 0 . 0 0 . 93 Special transactions and commodities not classified according to kind 1 2 62.4 5 2 -54.0 96 Coin (other than gold coin), not being legal tender 0 0 1 568.8 0 2 392.3 97 Gold, non-monetary (excluding gold, ores and concentrates) 178 332 86.4 306 505 65.3 1Standard International Trade Classification, Revision 4 (SITC, Rev. 4) 2Due to confidentiality in commodity group 56, this group can not be published separately. This group is included in group 59. Explanation of symbolsDownload table as ... - Mainland exports by county of production, commodity groups by the SITC. Year. NOK millionDownload table as ...Mainland exports by county of production, commodity groups by the SITC. Year. NOK million1 2
2024 Total mainland exports Distribution by the SITC Food, beverages and tobacco (SITC 0 and 1) Fish (subgroup 03 of SITC 0) Crude materials except fuels (SITC 2 and 4) Fuels (SITC 3) Chemicals and related products n.e.s (SITC 5) Manufactured goods (SITC 6) Machinery and transport equipment (SITC 7) Miscellanous manufactured articles (SITC 8) The whole country 708 902 181 725 168 103 37 687 100 699 80 238 128 683 132 498 47 372 County of production Viken (2020-2023) 0 0 0 0 0 0 0 0 0 Oslo 24 921 1 208 215 1 885 7 13 931 993 5 395 1 503 Innlandet 16 863 1 064 693 2 290 20 617 2 605 5 764 4 503 Agder 40 036 1 040 915 972 1 3 190 29 742 4 625 466 Rogaland 52 828 8 815 7 287 3 982 18 411 1 692 12 245 6 253 1 429 Vestland 140 754 35 813 34 011 3 816 59 313 3 184 22 785 13 623 2 220 Møre og Romsdal 63 880 35 809 33 041 3 062 2 2 563 14 805 5 433 2 205 Trøndelag - Trööndelage 44 341 27 335 26 519 2 079 45 5 583 3 966 2 786 2 548 Nordland - Nordlánnda 49 033 28 928 28 529 2 401 0 : 12 480 : 95 Troms og Finnmark - Romsa ja Finnmárku (2020-2023) 0 0 0 0 0 0 0 0 0 Svalbard 0 0 0 0 0 0 0 0 0 Jan Mayen 0 0 0 0 0 0 0 0 0 Norwegian goods produced in several counties 39 217 9 505 9 417 7 976 20 320 89 180 743 404 Re-exports of goods produced abroad3 99 915 2 579 1 267 1 240 1 172 4 171 11 600 60 103 19 050 County not stated4 21 453 2 999 2 101 1 242 9 1 305 2 494 9 050 4 353 1 2Standard International Trade Classification, Revision 4 (SITC, Rev. 4 3County of production is defined as the county for the major value added. When the exports consists of a mix of goods from different counties, and the county of production is hard to state, the definition Norwegian goods produced in several counties is used. In the case when the value of an imported intermediate good is more than doubled, the good is considered as produced in Norway. In the opposite it is considered as exports of goods produced abroad. 4County not stated implies no information about county of production is available. 12 July 2024: Table 10482 in StatBank has been updated with new figures for the years 2022 and 2023. Explanation of symbolsDownload table as ... - Imports and exports of goods, by trade areas, continents and selected countries. Year. NOK MillionDownload table as ...Imports and exports of goods, by trade areas, continents and selected countries. Year. NOK Million1
2024 Exports Imports Trade balance Total 1 805 403 1 060 663 744 740 Trade areas Nordic countries 288 348 191 367 96 981 EFTA 15 502 14 874 628 EU1 1 193 750 579 436 614 314 OECD 1 547 324 646 263 901 062 Developing countries 128 374 245 261 -116 887 LDC - least developed countries 4 947 8 371 -3 424 Continents and countries Europe 1 572 227 665 581 906 646 Belgium 94 166 22 511 71 655 Denmark 88 534 45 867 42 667 Estonia 2 920 7 021 -4 101 Finland 60 692 26 394 34 298 France 112 425 29 862 82 563 Greece 11 490 1 990 9 499 Ireland 6 602 6 549 53 Iceland 10 561 4 129 6 432 Italy 27 742 33 305 -5 563 Lithuania 18 925 12 191 6 734 Netherlands 191 849 49 288 142 561 Poland 105 646 36 995 68 651 Portugal 9 784 4 112 5 672 Romania 7 338 7 006 332 Russia 735 2 414 -1 679 Slovakia 1 412 4 127 -2 715 Spain 25 446 23 624 1 822 United Kingdom 339 064 49 944 289 119 Switzerland 4 938 10 664 -5 727 Sweden 125 090 112 905 12 185 Czechia 3 612 15 390 -11 778 Türkiye 13 322 11 646 1 676 Germany 280 672 112 762 167 910 Hungary 3 814 10 267 -6 453 Austria 4 031 7 273 -3 241 Other countries in Europe 21 417 17 345 4 072 Asia 111 044 226 452 -115 408 Hong Kong 2 983 1 586 1 397 India 3 987 9 277 -5 290 Japan 8 781 19 665 -10 884 China 42 180 128 431 -86 251 Malaysia 2 368 4 711 -2 343 Singapore 5 529 7 829 -2 300 South Korea 13 573 7 447 6 126 Taiwan 2 434 8 309 -5 876 Thailand 5 568 6 628 -1 060 Viet Nam 4 909 12 162 -7 252 Other countries in Asia 18 732 20 407 -1 675 Northern, Central America and the Caribbean 76 142 112 400 -36 258 Canada 8 983 20 342 -11 359 United States of America 61 756 82 677 -20 921 Other countries in North- and Central America 5 403 9 381 -3 978 South America 16 352 34 440 -18 088 Brazil 11 326 22 069 -10 743 Chile 2 639 4 243 -1 604 Peru 208 2 802 -2 594 Other countries in South-America 2 179 5 326 -3 147 Africa 25 078 17 822 7 256 Angola 4 077 417 3 660 Botswana 1 130 -129 South Africa 1 260 5 012 -3 752 Other countries in Africa 19 740 12 263 7 477 Oceania 4 560 3 968 592 Australia 3 923 2 780 1 143 New Zealand 431 484 -52 Other countries in Oceania 206 704 -498 1Figures for EU is without Great Britain from February 2020 on. Explanation of symbolsDownload table as ... - Imports and exports of goods (imports excl. ships and oil platforms and mainland exports), by trade areas, continents and selected countries. Year. NOK MillionDownload table as ...Imports and exports of goods (imports excl. ships and oil platforms and mainland exports), by trade areas, continents and selected countries. Year. NOK Million
2024 Mainland exports Imports excluding ships and oil platforms Trade balance Total 708 902 1 047 282 -338 380 Trade areas Nordic countries 136 910 189 124 -52 214 EFTA 15 500 14 852 648 EU1 405 530 577 544 -172 014 OECD 480 913 642 872 -161 959 Developing countries 109 808 238 723 -128 914 LDC - least developed countries 4 947 7 620 -2 673 Continents and countries Europe 497 859 660 832 -162 973 Belgium 22 690 22 493 197 Denmark 45 021 45 819 -797 Estonia 2 920 7 021 -4 101 Finland 11 238 26 394 -15 157 France 20 784 29 862 -9 078 Greece 2 183 1 990 192 Ireland 6 602 6 477 125 Iceland 10 559 4 107 6 452 Italy 16 253 33 305 -17 052 Lithuania 7 121 12 181 -5 059 Netherlands 67 651 49 288 18 363 Poland 34 237 36 995 -2 758 Portugal 7 496 4 112 3 385 Romania 4 198 7 006 -2 808 Russia 735 2 414 -1 679 Slovakia 1 412 4 127 -2 715 Spain 19 969 23 624 -3 655 United Kingdom 58 333 49 944 8 389 Switzerland 4 938 10 664 -5 727 Sweden 66 726 111 161 -44 435 Czechia 3 612 15 390 -11 778 Türkiye 7 972 10 169 -2 197 Germany 50 762 112 762 -62 000 Hungary 3 814 10 267 -6 453 Austria 4 031 7 273 -3 241 Other countries in Europe 16 602 15 987 615 Asia 96 675 219 265 -122 590 Hong Kong 2 710 1 586 1 124 India 3 987 9 277 -5 290 Japan 8 781 19 665 -10 884 China 29 783 125 021 -95 238 Malaysia 2 368 4 711 -2 343 Singapore 5 529 4 258 1 271 South Korea 12 373 7 447 4 926 Taiwan 2 434 8 309 -5 876 Thailand 5 568 6 628 -1 060 Viet Nam 4 909 12 162 -7 252 Other countries in Asia 18 233 20 201 -1 968 Northern, Central America and the Caribbean 70 025 112 400 -42 375 Canada 5 559 20 342 -14 782 United States of America 59 743 82 677 -22 934 Other countries in North- and Central America 4 723 9 381 -4 658 South America 15 096 34 440 -19 344 Brazil 11 326 22 069 -10 743 Chile 1 383 4 243 -2 860 Peru 208 2 802 -2 594 Other countries in South America 2 179 5 326 -3 147 Africa 24 793 17 071 7 723 Angola 4 077 417 3 660 Botswana 1 130 -129 South Africa 1 260 5 012 -3 752 Other countries in Africa -2 277 11 512 7 944 Oceania 4 454 3 275 1 179 Australia 3 923 2 780 1 143 New Zealand 431 484 -52 Other countries in Oceania 100 11 89 1Figures for EU is without Great Britain from February 2020 on. Explanation of symbolsDownload table as ... - Export of fish, by species. YearDownload table as ...Export of fish, by species. Year1
Million NOK Change in per cent 2023 2024 2023 - 2024 Total 165 246 168 103 1.7 Salmon2 122 270 122 569 0.2 Cod 12 261 11 718 -4.4 Herring 4 034 4 239 5.1 Mackerel 6 656 8 294 24.6 Coalfish 3 960 3 717 -6.1 Haddock 1 704 1 659 -2.6 Trout 5 497 6 769 23.1 Shrimps3 : : : Halibut 1 406 1 343 -4.5 Ling 459 436 -5.0 Cusk 306 251 -18.0 Redfish 786 854 8.7 Other fish 2 616 2 710 3.6 Other crustacean/ mollusc 3 292 3 544 7.7 1Within the SITC classification group 03 'Fish, crustaceans, molluscs and other aquatic invertebrates', Statistics Norway has grouped everything by species based on the product groups in the HS nomenclature. Some discrepancies may occur since not all product groups are specified by species. The group 'Other fish' is the sum of the remaining product groups under SITC 03. 2Salmon contains more than the weekly figures of exports of salmon, fillets and other prepared salmon is also included. 3Due to confidentiality in group “Shrimps” from 2013 on, exports in this group can not be published separately. This group is therefore included in commodity group “Other crustaceous animals except shrimps and mollusk”. Explanation of symbolsDownload table as ... - First revision of yearly figures of imports and exports. Commodity groups by SITCDownload table as ...First revision of yearly figures of imports and exports. Commodity groups by SITC1
2023 Imports Exports NOK Million Change in per cent NOK Million Change in per cent TOTAL 1 024 276 0.4 1 881 134 0.4 Of which: Crude oil 12 229 0.0 538 069 2.5 Natural gas, whether or not liquefied 455 0.0 627 945 -0.9 Natural gas condensates 569 2.4 5 320 0.0 Ships and oil platforms 11 512 24.3 3 099 58.3 Goods excl. ships and oil platforms 1 012 764 -0.1 1 878 0.4 Mainland exports . . 706 701 0.0 0 Food and live animals 74 376 0.0 178 088 -0.2 00 Live animals other than animals of div.03 258 0.0 138 0.0 01 Meat and meat preparations 1 886 0.0 356 -0.3 02 Dairy products and birds' eggs 2 463 0.0 227 -0.1 03 Fish, crustaceans, molluscs and prep. thereof 6 595 0.0 165 246 -0.1 04 Cereals and cereal preparations 9 457 -0.1 817 -0.5 05 Vegetables and fruit 17 517 0.0 325 0.0 06 Sugars, sugar prepatations and honey 2 988 0.0 63 -0.6 07 Coffee, tea, cocoa, spices 6 872 -0.1 636 -8.2 08 Feeding stuff for animals (not cereals) 18 578 0.2 7 118 -1.0 09 Miscellaneous edible products 7 760 0.1 3 161 -2.6 1 Beverages and tobacco 15 561 -0.2 1 201 -2.4 11 Beverages 10 611 0.0 1 179 -2.4 12 Tobacco and tobacco manufactures 4 950 -0.6 22 -0.3 2 Crude materials, inedible, except fuels 68 668 0.0 28 960 0.2 21 Hides, skins and furskins, raw 62 0.0 356 0.0 22 Oil seeds and oleaginous fruits 3 136 0.1 6 0.0 23 Crude rubber 187 -0.1 70 0.0 24 Wood, lumber and cork 5 445 0.0 6 659 0.0 25 Pulp and waste paper 546 0.0 3 923 -0.1 26 Textile fibres and their waste 164 -2.1 324 0.0 27 Crude fertilizers and crude minerales 6 708 0.1 6 516 1.1 28 Metalliferous ores and metal scrap 48 525 0.0 10 649 0.0 29 Crude animal and vegetable materials 3 895 0.0 458 0.4 3 Mineral fuels, lubricants and related materials 89 204 0.0 1 287 417 0.6 32 Coal, coke and briquettes 5 327 0.0 91 913.9 33 Petroleum, petroleum products 73 785 0.0 612 883 2.2 334 Petroleum oils and oils obtained from bituminous minerals (other than crude); preparations, n.e.s., containing by weight 70% or more of petroleum oils or of oils obtained from bituminous minerals, these oils being the basic constituents of the preparation 54 940 0.0 68 699 0.0 34 Gas , natural and manufactured 1 835 0.0 647 107 -0.8 342 Liquefied propane and butane 1 347 0.0 17 721 0.7 35 Electric current 8 258 0.0 27 336 0.0 4 Animal and vegetable oils, fats and waxes 17 541 0.0 5 595 0.0 41 Animal oils and fats 9 799 0.0 3 193 0.0 42 Fixed vegetable fats and oils, crude, refined or fractionated 7 241 0.0 849 -0.1 43 Animal or vegetable fats and oils, processed 501 0.4 1 553 -0.2 5 Chemicals and related products n.e.s. 109 621 0.0 83 085 -0.1 51 Organic chemicals 12 534 -0.2 18 171 0.1 52 Inorganic chemicals 11 307 0.0 15 120 0.2 53 Dyeing, tanning and colouring materials 4 668 0.0 2 109 0.0 54 Medicinal and pharmaceutical products 29 498 0.1 11 178 0.0 55 Essential oils and resinoids etc 12 661 0.1 2 849 -0.1 56 Fertilizers2 5 609 0.0 : : 57 Plastics in primary forms 6 685 -0.1 8 803 0.0 58 Plastics in non-primary forms 9 001 0.0 2 573 0.0 59 Chemical materials and products, n.e.s. 17 657 0.0 8 082 0.0 6 Manufactured goods classified chiefly by material 131 512 0.0 130 804 -1.9 61 Leather, leather manufactures, furskins 554 0.0 127 0.0 62 Rubber manufactures, n.e.s. 7 545 0.0 1 212 -0.3 63 Cork and wood manufactures 9 237 0.0 2 320 0.0 64 Paper, paperboard and manufactures thereof 10 575 0.0 7 244 -0.1 65 Textile yarn, fabrics, made-up articles 10 898 0.0 2 918 -0.1 66 Non-metallic mineral manufactures, n.e.s. 12 898 0.0 2 582 -0.3 67 Iron and steel 22 822 0.0 20 814 -0.4 68 Non-ferrous metals 12 664 0.0 82 100 0.0 69 Manufactures of metals, n.e.s. 44 318 0.0 11 488 -17.7 7 Machinery and transport equipment 380 671 0.3 120 121 3.1 71 Power generating machinery and equipment 17 377 0.0 12 395 0.0 72 Machinery for special industries 39 015 -0.3 14 883 0.1 73 Metal working machinery 3 233 -0.4 824 -0.6 74 General industrial machinery and equipment 56 268 -0.1 22 953 -0.1 75 Office machines, data processing machines 24 580 0.0 6 037 0.0 76 Telecommunications apparatus and equipment 35 606 0.0 9 595 -0.1 77 Electrical machinery and apparatus 64 563 -0.1 24 904 10.9 78 Road vehicles 112 176 -0.2 17 395 0.0 79 Other transport equipment including ships 27 854 5.3 11 135 12.1 8 Miscellaneous manufactured articles 134 770 -0.1 44 012 -0.1 81 Prefabricated buildings 10 354 -0.2 2 238 0.0 82 Furniture and parts thereof 19 226 0.0 3 728 0.0 83 Travel goods, handbags etc. 2 899 0.0 290 0.0 84 Articles of apparel and accessories 26 654 -0.1 3 030 -0.1 85 Footwear 7 328 0.0 839 -0.1 87 Professional and scientific instruments 23 367 -0.2 18 512 -0.5 88 Photographic and optical goods 4 471 0.0 448 -0.5 89 Miscellaneous manufactured articles, n.e.s 40 471 -0.1 14 927 0.2 9 Other commodities and transactions 2 354 0.0 1 852 0.0 91 Postal packages not classified according to kind 0 0.0 0 0.0 93 Special transactions and commodities not classified according to kind 1 292 0.0 56 0.0 96 Coin (other than gold coin), not being legal tender 55 0.0 3 0.0 97 Gold, non-monetary (excluding gold, ores and concentrates) 1 006 0.0 1 793 0.0 1 2Due to confidentiality commodity group 56 is included in commodity group 59. Explanation of symbolsDownload table as ...
Norwegian import and export - all countries and commodity numbers 1988-2024.
Complete datasets corresponding to Statbank table 08801 for download as CSV.

About the statistics
The information under «About the statistics» was last updated 28 June 2024.
Imports and exports
Imports comprise mainly foreign manufactured goods entering Norway. This can also include re-importation of originally Norwegian-produced goods and processed goods. Exports comprise domestically produced goods sent out of Norway, i.e. the Norwegian statistical territory as defined in Section of population. Also included are reexportation of originally foreign-produced goods and processed goods.
Trade in goods is based on the physical movement of goods across borders, but for some items, such as ships, oil platforms and aircraft, trading often takes place without the occurrence of such movement. Whether there has been an import or export of such goods is therefore determined based on whether a change in economic ownership has taken place cf. also described in the Section of population. Economic ownership is defined as the person entitled to claim the economic benefit and who has the legal responsibility for the risk of the item.
Mainland exports
As from March 2013, the statistics on external trade in goods will use the term mainland exports on the exportation of goods other than crude oil, natural gas, natural gas condensates, ships and oil platforms. Previously, we also used the term traditional goods for these exports, as well as for imports excluding ships and oil platforms. (Balance of payments and the research department still use the term traditional goods. The balance of payments also includes items such as naphtha, propane and butane in its collective term crude oil and natural gas, external trade in goods does not.)
Country
Country of origin is used for imports. With regard to exports, the country of destination is used.
For raw materials, the country of origin is determined according to where the goods are produced. For manufactured goods (processed and refined goods), this is the country in which the goods have obtained the form they have at the time of import. The country of destination is defined as the country, which, on the date of export, is the last known country for which the goods are intended.
For more specific principles in relation to country of origin, the rule for ships, aircraft and oil platforms is that country of origin is the country that previously owned the goods (economic ownership). For Norwegian-produced goods sold abroad and subsequently bought in Norway, the country from which the goods are imported shall be given as the country of origin (manufacturing country).
Mode of transport
Mode of transport is defined as the means of transportation used when goods cross the border, either by import or export (in the Database for Standard Classifications there is a detailed description of mode of transport).
Quantity
For most goods, the quantity is expressed in kilograms (weight excluding packaging), except for ships and electricity, which are measured by gross tonnes and kWh respectively. However, for many goods, the quantity is also available in a different unit of measurement, such as pieces, barrels, cubic metres, carat, litres, pairs etc.
Statistical value
Statistical value is the value when crossing the Norwegian border. Duties, VAT and other taxes are not included in the statistical value.
Upon import, the value should be set to the CIF (Cost Insurance Freight) value, i.e. the value of the goods at the Norwegian border, including the costs associated with the delivery of goods to the border, transport costs and insurance. Similarly, for exports it is the value at the Norwegian border, including the costs associated with transporting it there, called FOB (Free On Board) value. CIF and FOB are two types of delivery terms called Incoterms. The delivery terms are an agreement between buyer and seller as to who bears the risk, responsibility and cost of transportation of the goods to the agreed place. In the Database for Standard Classifications there is an overview of the different delivery terms.
For crude oil exported by ship directly from installations on the Norwegian continental shelf, the value upon departure from the installation is used. In the case of crude oil and natural gas that is piped abroad, this value is determined based onon when it leaves the Norwegian continental shelf. The value of transport in international waters and into a terminal abroad is regarded as export of services.
The statistical value of exports and imports of ships is the transfer value including takeover of debt. With regard toto fish landed abroad (exported) by Norwegian vessels and caught outside the Norwegian customs border, the statistical value is the value of the fish paid to the fishing operator upon the sale of stock (minus the sales organisation fee).
County of production
The county of production is defined as the county in which the added value is greatest.
Classification of goods
The classification by HS (the international customs and statistics nomenclature, the Harmonized System) is a 6-digit grouping of goods organised primarily according to the material characteristics of goods at the time of crossing the border. Only in exceptional cases is the later use of the goods of any significance to the classification. The WCO (World Customs Organization) is responsible for this nomenclature.
The Norwegian customs tariff is based on the HS, but has two more digits, which are national codes. The 7th digit reflects national customs divisions/tariff rates (bound in the WTO - World Trade Organization). The 8th digit is used to cover the national statistical needs and and among others the interests of the Norwegian Agricultural Authority and Ministry of Foreign Affairs interests with regard to import and export regulations. In some cases, the 8th digit is also used to distinguish between goods subject to duties and/or fees. The Norwegian version is published annually on our website along with a text version of the nomenclature developed by Statistics Norway. The detailed commodity list, which includes all commodity numbers, also provides information about the validity of each commodity number.
Due to technological developments and changes in international trade, the HS nomenclature is normally updated every 5 years – with the most recent implementation on 1 January 2012. In addition, minor changes are made in the Norwegian customs tariff every year. The EU also uses the nomenclature of the HS in its publication of foreign trade figures. However, the EU version (available at Eurostat's website); the Combined Nomenclature (CN) - which also has eight digits - is more detailed than the Norwegian version. As mentioned previously, only the first 6 digits are common internationally.
When publishing external trade figures, the UN Standard International Trade Classification (SITC) is mainly used. Here the goods are grouped by level of processing (raw materials, semi-finished and finished goods). As from 1988 to 2006, the SITC-Rev.3 (unstats.un.org) is used, but as of 2007 the SITC-Rev. 4 (available at unstats.un.org as PDF) is used.
The classification BEC (Broad Economic Categories) (at unstats.un.org); the UN classification of commodities by end use, which is based on the SITC, is also used to some extent. This classification is not considered to be a "standard classification" in the same way as for example the SITC, and it is officially acknowledged that countries may have their own version of this grouping in order to satisfy national needs. The Norwegian version of this classification can be found in the Database for Standard Classifications.
The various nomenclatures are listed on the UN’s website, as well as correspondence tables between the different nomenclatures HS, SITC and BEC and their different versions.
The product classification CPA divides goods by industry group, and in external trade we use extracts from this. CPA (Statistical Classification of Productivity by Activity in the European Community) is the EU's central Product by Activity classification. It is a product group that is closely linked to industry, i.e. distinctive products within each activity can be linked to the activity classification NACE Rev.2.
Grouping by country
The Norwegian list of countries used follows the international standard ISO-3166. EU countries use the same standard, except for some deviations of less importance.
In the external trade publications these country groupings are frequently used:
- Nordic countries - trade with Sweden, Denmark, Greenland, Faroe Islands, Finland, Åland and Iceland
- EFTA - trade with Iceland, Switzerland and Liechtenstein. European Free Trade Association - Wikipedia
- EU – in the Database for standard classifications current member states at any given time is available
- OECD - for current member states at any given time see the OECD's website
- Developing countries – as from 2007, the figures are according to the OECD’s DAC (DAC stands for Development Assistance Committee) for definitions of countries at any given time that are recognised as recipients of official foreign aid. The DAC list also includes a section on LDCs (Least Developed Countries - defined by the UN) - which we also use in the statistics.
(Until 2006, these countries were defined as developing countries in the Norwegian trade statistics: Bosnia-Herzegovina, Yugoslavia (Serbia and Montenegro), Croatia, Macedonia, Malta, Slovenia - Africa except South Africa - Asia excluding Japan, North and South America except USA, Canada and Greenland - Oceania except Australia and New Zealand.)
Contact
Opplysningstjenesten for utenrikshandelen
utenrikshandel@ssb.noRelatert innhold
Analyses, articles and publications
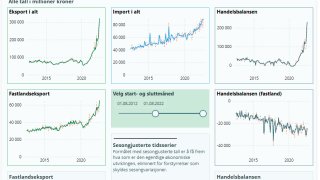 Article / 17 February 2025Visualisation of seasonally adjusted figures for external trade in goodsWhat is shown in the latest figures for external trade in goods ? The unadjusted monthly figures are affected by calendar effects and seasonal variations. Seasonally adjusted series are better for evaluating changes in the economic indicators over time. The number of series for seasonally adjusted figures in the Statbank is now increased from 6 to 38 and most of these are included in this visualisation.
 Article / 6 February 2025Commodity List External TradeThe Commodity List follows the nomenclature of the Norwegian Customs Tariff, as from 1988 based on the combined tariff/statistical nomenclature, the Harmonized System (HS).