Content
Published:
This is an archived release.
Better utilisation of capacity
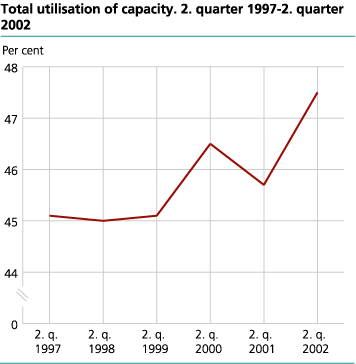
The total utilisation of capacity - with and without cargo - for Norwegian lorries was 47.5 per cent in the second quarter of 2002, an increase of 1.8 percentage points compared with the corresponding period last year. Norwegian lorries carried 54.9 million tonnes of goods, and travelled 334.3 million kilometres. This constituted 3 256.6 million tonne-kilometres.
The lorry survey for the second quarter of 2002 shows that 27.4 per cent of the total kilometres travelled were empty. This is 3.7 percentage points more than in the corresponding period last year. In the first six months this year, the percentage of empty running was 25.6 per cent, compared with 26.2 per cent in the first six months last year.
Higher utilisation of capacity
The utilisation of capacity with cargo was 65.0 per cent in the second quarter this year. The utilisation was 71.2 per cent when corrected for volume goods. This is considerably higher than in the second quarter of 2001, when the utilisation was 60.5 and 66.5 per cent respectively.
Increase in transport performance
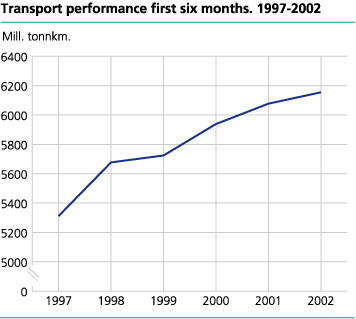
During the second quarter of 2002 the transport performance was 3 256.6 million tonne-kilometres. This is an increase of 54.4 million tonne-kilometres or 1.7 per cent compared with the second quarter of2001. The transport performance in the first six months of 2002 was 6154.7 million tonne-kilometres, an increase of 77.4 million tonne-kilometres or 1.3 per cent since the first six months last year.
Norwegian lorries transported 54.9 million tonnes of goods during the second quarter of 2002. This is 1.1 million tonnes more than in the corresponding quarter last year. During the first six months of 2002 Norwegian lorries transported 101.5 million tonnes of goods compared with 104.1 million tonnes in the first six months of 2001.
Tables:
- Table 1 Transport performances. Quarter
- Table 2 Tonnage carried, by group of vehicle. Quarter. Mill. tonnes
- Table 3 Transport performances, by group of vehicle. Quarter. Mill. tonne-kms
- Table 4 Tonnage carried, by length of journey. Quarter. Mill. tonnes
- Table 5 Transport performances, by length of journey. Quarter. Mill. tonne-kms
- Table 6 Tonnage carried, by commodity. Quarter. Mill. tonnes
- Table 7 Transport performances, by commodity. Quarter. Mill. tonne-kms
The statistics is now published as Carriage of goods by lorry.
Contact
-
Statistics Norway's Information Centre
E-mail: informasjon@ssb.no
tel.: (+47) 21 09 46 42


